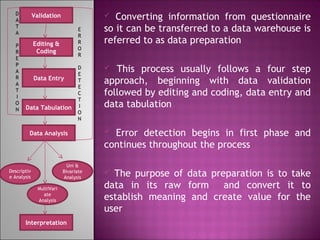
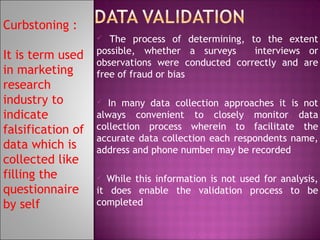
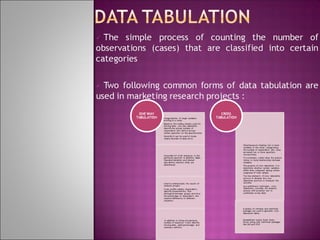
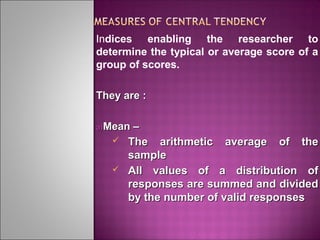
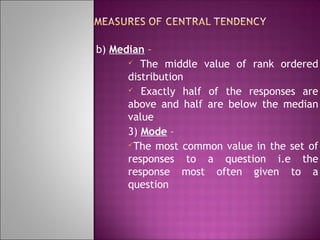
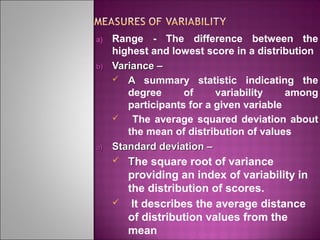
1)
2)
3)

Stage of preparing
data preparation
Data Analysis
Descriptive statistics

1)

By Prof. Sachin Udepurkar
D
A
T
A

Validation

P
R
E
P
A
R
A
T
I
O
N

Editing &
Coding

E
R
R
O
R

Data Entry

Data Tabulation

D
E
T
E
C
T
I
O
N

Data Analysis

Uni &
Bivariate
Analysis

Descriptiv
e Analysis

Converting information from questionnaire
so it can be transferred to a data warehouse is
referred to as data preparation


MultiVari
ate
Analysis

Interpretation

This process usually follows a four step
approach, beginning with data validation
followed by editing and coding, data entry and
data tabulation


Error detection begins in first phase and
continues throughout the process


The purpose of data preparation is to take
data in its raw form
and convert it to
establish meaning and create value for the
user

Curbstoning :
The process of determining, to the extent
possible, whether a surveys
interviews or
observations were conducted correctly and are
free of fraud or bias


It is term used
in marketing
research
industry to
indicate
falsification of
data which is
collected like
filling the
questionnaire
by self

In many data collection approaches it is not
always convenient to closely monitor data
collection process wherein to facilitate the
accurate data collection each respondents name,
address and phone number may be recorded


While this information is not used for analysis,
it does enable the validation process to be
completed

Data
Validation
areas :
1)Fraud
2)Screening
3)Procedure
4)Completene
ss
5)Courtesy



Process of data validation covers five areas :

1.

FRAUD : To infer that whether
Person was actually interviewed or not
 Did the interviewer contact respondent
simply to get a name/address and then
proceed to fabricate responses?
 Did the interviewer used the friend to obtain
the necessary information?
SCREENING : To ensure accuracy of data
collected in set prescribed criteria such
Household income level, recent purchase of
a specific product and brand or even gender
or age. Like
 Interview procedure may require that only
female heads of households with an annual
household income of Rs 25000 or more be
interviewed. In this case validation callback
would verify each of these factors

Data
Validation
areas :
1)Fraud
2)Screening
3)Procedure
4)Completene
ss
5)Courtesy



Process of data validation covers five areas :

PROCEDURE: In marketing research, it is
critical that the data be collected according to a
specific procedure. Like


Many customer exit interviews must occur in
a designated place as the respondent leaves a
certain retail establishment. Here a validation
callback may be necessary to ensure that
interview took place at the proper setting, not
some social gathering area like a party or a
park

Data
Validation
areas :
1)Fraud
2)Screening
3)Procedure
4)Completene
ss
5)Courtesy



Process of data validation covers five areas :

COMPLETENESS: In order to speed through the
data collection process , an interviewer may ask
the respondent only a few of requisite questions
and then make up answers to remaining questions


To determine if the interview is valid ,
researcher could recontact a sample of
respondents and ask about questions from
different parts of interview form

Data
Validation
areas :
1)Fraud
2)Screening
3)Procedure
4)Completene
ss
5)Courtesy

Process whereby data must be edited for
mistakes wherein raw data is checked for
mistakes made by either interviewer or
respondent is called as data editing


By scanning each completed interview , the
researcher can check following areas of concern :







Asking the proper questions
Accurate recording of answers
Correct screening questions
Responses to open ended ended questions
Grouping and assigning value to various
responses from the survey instrument


Codes are typically numerical number from 0 to
9 because numbers are quick and easy to input
and computers work better with numbers than
alphanumerical values


It can be tedious if certain issues are not
addressed prior to collecting the data


Like - well planned and constructed
questionnaire can reduce the amount of time
spent on coding and increase the accuracy of the
process if it is incorporated into design of
questionnaire

In questionnaires that do not use such simple
coded responses, the researcher will establish a
master code on which the assigned numeric values
are shown


Researchers typically use a four step process to
develop codes for responses :


1.

2.

3.
4.

Generating list of as many potential
responses as possible and Assigning
values to generated responses
Consolidation of responses is actually
the second phase of the four step
process – having same meaning clubbed
to one
Assign a numerical value as code
Assign a coded value to each response
Those task involved with the direct input of the
coded data into some specified software package that
ultimately allows the research analyst to manipulate
and transform the raw data into useful information




It follows validation, editing and coding

It is the procedure used to enter the data into the
computer for subsequent data analysis


It includes those tasks involved with the direct input
of the coded data into a software package that enables
the research analyst to manipulate and transform the
raw data into useful information


One critical task of data entry personnel is to ensure
that the data entered is correct and error free

First step in error detection is to determine whether
the software used for data entry and tabulation will
allow the researcher to perform “error edit routines”
which identifies the wrong type of data. Example – Say
that for a particular field on a given data record, only
the codes of 1 or 2 should appear. An error edit routine
can display an error message on the data output if any
number other than 1 or 2 has been entered


Another approach to error detection is for the
researcher to review a printed representation of
entered data


The final approach to error detection is to produce a
data/column list for the entered data. Quick view of
this data/column list procedure can indicate to the
analyst whether inappropriate codes were entered into
data fields

Once

the data have been collected and prepared
for analysis, there are some basic statistical
analysis procedures that MR will want to perform
An

obvious need for these statistics comes from
the fact that almost all data sets are
disaggregated
Graphics

should be used whenever practical
availing information user to quickly grasp the
essence of the information developed in research
project
Charts

also can be an effective visual aid to
enhance the communication process and add
clarity and impact to research reports i.e Bar
Charts, Line charts, pie or round chart

Data must be accurately scored and
systematically organized to facilitate data
analysis vide descriptive analysis,
univariate ,bivariate analysis and
multivariate analysis


Descriptive statistics : permit the
researcher to describe many pieces of data
with a few indices
Statistics : indices calculated by the
researcher for a sample drawn from a
population
Parameter : indices calculated by the
researcher for an entire population
Types of descriptive statistics :
1) Graphs
2) Measures of Central Tendency
3) Measures of central variability

Graphs :
a.Representations of data enabling the
researcher to see what the distribution of
scores look like Bar graph, line graph and
Pie or Round chart
Indices enabling the researcher to
determine the typical or average score of a
group of scores.
They are :
a)Mean

–
 The arithmetic average of the
sample
 All values of a distribution of
responses are summed and divided
by the number of valid responses
b) Median –
 The middle value of rank ordered
distribution
 Exactly half of the responses are
above and half are below the median
value
3) Mode –
The most common value in the set of
responses to a question i.e the
response most often given to a
question
Indices enabling the researcher to indicate
how spread out a group of scores are
They are :
a)Range
b)Quartile

deviation
c) Variance
d)Standard Deviation
Indices enabling the researcher to
determine the typical or average score of a
group of scores.
They are :
a)Mean

–
 The arithmetic average of the
sample
 All values of a distribution of
responses are summed and divided
by the number of valid responses
a)

b)

a)

Range - The difference between the
highest and lowest score in a distribution
Variance –
 A summary statistic indicating the
degree
of
variability
among
participants for a given variable

The average squared deviation about
the mean of distribution of values
Standard deviation –




The square root of variance
providing an index of variability in
the distribution of scores.
It describes the average distance
of distribution values from the
mean

Data analysis market research

  • 1.
    1) 2) 3) Stage of preparing datapreparation Data Analysis Descriptive statistics 1) By Prof. Sachin Udepurkar
  • 2.
    D A T A Validation P R E P A R A T I O N Editing & Coding E R R O R Data Entry DataTabulation D E T E C T I O N Data Analysis Uni & Bivariate Analysis Descriptiv e Analysis Converting information from questionnaire so it can be transferred to a data warehouse is referred to as data preparation  MultiVari ate Analysis Interpretation This process usually follows a four step approach, beginning with data validation followed by editing and coding, data entry and data tabulation  Error detection begins in first phase and continues throughout the process  The purpose of data preparation is to take data in its raw form and convert it to establish meaning and create value for the user 
  • 3.
    Curbstoning : The processof determining, to the extent possible, whether a surveys interviews or observations were conducted correctly and are free of fraud or bias  It is term used in marketing research industry to indicate falsification of data which is collected like filling the questionnaire by self In many data collection approaches it is not always convenient to closely monitor data collection process wherein to facilitate the accurate data collection each respondents name, address and phone number may be recorded  While this information is not used for analysis, it does enable the validation process to be completed 
  • 4.
    Data Validation areas : 1)Fraud 2)Screening 3)Procedure 4)Completene ss 5)Courtesy  Process ofdata validation covers five areas : 1. FRAUD : To infer that whether Person was actually interviewed or not  Did the interviewer contact respondent simply to get a name/address and then proceed to fabricate responses?  Did the interviewer used the friend to obtain the necessary information? SCREENING : To ensure accuracy of data collected in set prescribed criteria such Household income level, recent purchase of a specific product and brand or even gender or age. Like  Interview procedure may require that only female heads of households with an annual household income of Rs 25000 or more be interviewed. In this case validation callback would verify each of these factors 
  • 5.
    Data Validation areas : 1)Fraud 2)Screening 3)Procedure 4)Completene ss 5)Courtesy  Process ofdata validation covers five areas : PROCEDURE: In marketing research, it is critical that the data be collected according to a specific procedure. Like  Many customer exit interviews must occur in a designated place as the respondent leaves a certain retail establishment. Here a validation callback may be necessary to ensure that interview took place at the proper setting, not some social gathering area like a party or a park 
  • 6.
    Data Validation areas : 1)Fraud 2)Screening 3)Procedure 4)Completene ss 5)Courtesy  Process ofdata validation covers five areas : PROCEDURE: In marketing research, it is critical that the data be collected according to a specific procedure. Like  Many customer exit interviews must occur in a designated place as the respondent leaves a certain retail establishment. Here a validation callback may be necessary to ensure that interview took place at the proper setting, not some social gathering area like a party or a park 
  • 7.
    Data Validation areas : 1)Fraud 2)Screening 3)Procedure 4)Completene ss 5)Courtesy  Process ofdata validation covers five areas : COMPLETENESS: In order to speed through the data collection process , an interviewer may ask the respondent only a few of requisite questions and then make up answers to remaining questions  To determine if the interview is valid , researcher could recontact a sample of respondents and ask about questions from different parts of interview form 
  • 8.
    Data Validation areas : 1)Fraud 2)Screening 3)Procedure 4)Completene ss 5)Courtesy Process wherebydata must be edited for mistakes wherein raw data is checked for mistakes made by either interviewer or respondent is called as data editing  By scanning each completed interview , the researcher can check following areas of concern :      Asking the proper questions Accurate recording of answers Correct screening questions Responses to open ended ended questions
  • 9.
    Grouping and assigningvalue to various responses from the survey instrument  Codes are typically numerical number from 0 to 9 because numbers are quick and easy to input and computers work better with numbers than alphanumerical values  It can be tedious if certain issues are not addressed prior to collecting the data  Like - well planned and constructed questionnaire can reduce the amount of time spent on coding and increase the accuracy of the process if it is incorporated into design of questionnaire 
  • 10.
    In questionnaires thatdo not use such simple coded responses, the researcher will establish a master code on which the assigned numeric values are shown  Researchers typically use a four step process to develop codes for responses :  1. 2. 3. 4. Generating list of as many potential responses as possible and Assigning values to generated responses Consolidation of responses is actually the second phase of the four step process – having same meaning clubbed to one Assign a numerical value as code Assign a coded value to each response
  • 11.
    Those task involvedwith the direct input of the coded data into some specified software package that ultimately allows the research analyst to manipulate and transform the raw data into useful information   It follows validation, editing and coding It is the procedure used to enter the data into the computer for subsequent data analysis  It includes those tasks involved with the direct input of the coded data into a software package that enables the research analyst to manipulate and transform the raw data into useful information  One critical task of data entry personnel is to ensure that the data entered is correct and error free 
  • 12.
    First step inerror detection is to determine whether the software used for data entry and tabulation will allow the researcher to perform “error edit routines” which identifies the wrong type of data. Example – Say that for a particular field on a given data record, only the codes of 1 or 2 should appear. An error edit routine can display an error message on the data output if any number other than 1 or 2 has been entered  Another approach to error detection is for the researcher to review a printed representation of entered data  The final approach to error detection is to produce a data/column list for the entered data. Quick view of this data/column list procedure can indicate to the analyst whether inappropriate codes were entered into data fields 
  • 14.
    Once the data havebeen collected and prepared for analysis, there are some basic statistical analysis procedures that MR will want to perform An obvious need for these statistics comes from the fact that almost all data sets are disaggregated Graphics should be used whenever practical availing information user to quickly grasp the essence of the information developed in research project Charts also can be an effective visual aid to enhance the communication process and add clarity and impact to research reports i.e Bar Charts, Line charts, pie or round chart 
  • 15.
    Data must beaccurately scored and systematically organized to facilitate data analysis vide descriptive analysis, univariate ,bivariate analysis and multivariate analysis  Descriptive statistics : permit the researcher to describe many pieces of data with a few indices Statistics : indices calculated by the researcher for a sample drawn from a population Parameter : indices calculated by the researcher for an entire population
  • 16.
    Types of descriptivestatistics : 1) Graphs 2) Measures of Central Tendency 3) Measures of central variability Graphs : a.Representations of data enabling the researcher to see what the distribution of scores look like Bar graph, line graph and Pie or Round chart
  • 17.
    Indices enabling theresearcher to determine the typical or average score of a group of scores. They are : a)Mean –  The arithmetic average of the sample  All values of a distribution of responses are summed and divided by the number of valid responses
  • 18.
    b) Median – The middle value of rank ordered distribution  Exactly half of the responses are above and half are below the median value 3) Mode – The most common value in the set of responses to a question i.e the response most often given to a question
  • 19.
    Indices enabling theresearcher to indicate how spread out a group of scores are They are : a)Range b)Quartile deviation c) Variance d)Standard Deviation
  • 20.
    Indices enabling theresearcher to determine the typical or average score of a group of scores. They are : a)Mean –  The arithmetic average of the sample  All values of a distribution of responses are summed and divided by the number of valid responses
  • 21.
    a) b) a) Range - Thedifference between the highest and lowest score in a distribution Variance –  A summary statistic indicating the degree of variability among participants for a given variable  The average squared deviation about the mean of distribution of values Standard deviation –   The square root of variance providing an index of variability in the distribution of scores. It describes the average distance of distribution values from the mean