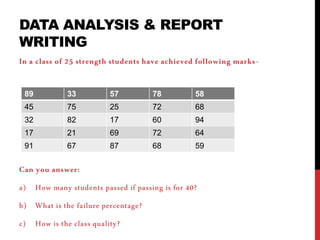
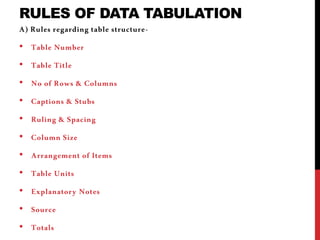
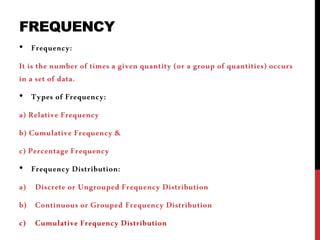
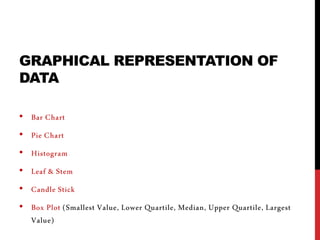
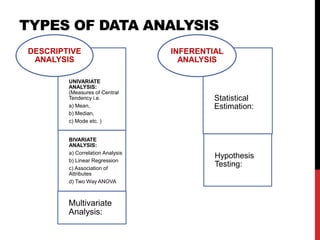
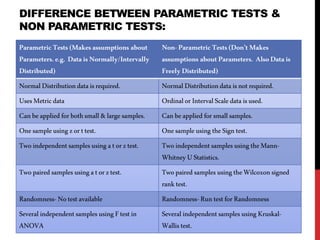
This document provides information on data analysis and report writing. It discusses topics such as data collection, processing, analysis, univariate analysis including measures of central tendency, bivariate analysis including correlation and regression, and hypothesis testing. It also outlines the structure of a research report including sections like the executive summary, introduction, methodology, findings, and provides examples of tables, charts, and data interpretation.

![BASIC COMPONENTS OF CONTINUOUS OR
GROUPED FREQUENCY DISTRIBUTION
• Class Limits:
• Class Intervals: [C.I. =
(𝐿−𝑆)
𝐾
] [Exclusive/Continuous Class,
Inclusive/Discontinuous Class, Open Ended Class]
• Range
• Mid Value or Mid Point
• Frequency
• Number of Class Intervals: [K=1 + 3.322log10 𝑁]
• Size of Class Interval: [C=
𝑅𝑎𝑛𝑔𝑒
1+3.322log10 𝑁
] i.e.
𝑅𝑎𝑛𝑔𝑒
𝐾](https://image.slidesharecdn.com/dataanalysisreportwriting-190830065617/85/Data-analysis-amp-report-writing-9-320.jpg)
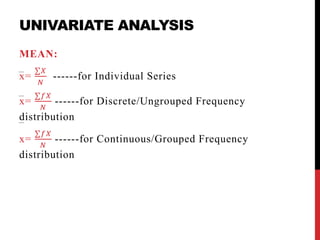
![UNIVARIATE ANALYSIS
MEDIAN:
Md= Value of [
𝑁+1
2
]th Observation in ascending order
------for Individual
Series
Md= Value of [
𝑁+1
2
]th Observation in ascending order
------for Discrete/Ungrouped Frequency distribution
i) Find Less Than c.f.
ii) Then find median class= class to which [
𝑁
2
]th observation
belongs
iii) Md= l+
ℎ
𝑓
[
𝑁
2
− 𝑐]
(where, l-Lower Limit of Median Class, h- Size of Median Class, f-
Frequency of Median Class, C- Cumulative Frequency of Class
immediately preceding the Median Class)
------for Continuous/Grouped Frequency distribution](https://image.slidesharecdn.com/dataanalysisreportwriting-190830065617/85/Data-analysis-amp-report-writing-13-320.jpg)
![UNIVARIATE ANALYSIS
MODE:
M0= Value with maximum frequency
------for Individual
Series
M0= Value having maximum frequency
------for Discrete/Ungrouped Frequency
distribution
i) Find Modal Class i.e. class with highest frequency
then
ii) M0= l+h [ 𝑓1
−𝑓0
2𝑓1
−𝑓0
−𝑓2
−
]
------for Continuous/Grouped Frequency
distribution
Mode = [3Median -
2Mean]](https://image.slidesharecdn.com/dataanalysisreportwriting-190830065617/85/Data-analysis-amp-report-writing-14-320.jpg)
![CORRELATION ANALYSIS
KARL PEARSON’S COEFFIECIENT OF
CORRELATION (r):
rxy =
𝑪𝒐𝒗(𝒙,𝒚)
𝟔 𝒙
𝟔 𝒚
=
𝑵∑𝒙𝒚− ∑𝒙 −(∑𝒚)
√[𝑵∑𝒙 𝟐
− ∑𝒙 𝟐
][𝑵∑𝒚 𝟐
− ∑𝒚 𝟐
]
COEFFICIENT OF DETERMINATION = r2
SPEARMAN’S RANK CORRELATION COEFFICIENT
(þ):
Þ=1-
𝟔∑𝒅 𝟐
𝑵(𝑵 𝟐
−𝟏)
(where d is difference between ranks)](https://image.slidesharecdn.com/dataanalysisreportwriting-190830065617/85/Data-analysis-amp-report-writing-18-320.jpg)


![BASIC CONCEPTS in STAT 1 [Autosaved].pptx](https://cdn.slidesharecdn.com/ss_thumbnails/basicconceptsinstat1autosaved-221027115944-55c11ebb-thumbnail.jpg?width=640&height=640&fit=bounds)


