There are two types of data: primary and secondary. Primary data is collected directly by the researcher through methods like questionnaires, observations, interviews, and surveys. Secondary data is previously collected data from sources like government publications, journals, and reports.
Data collection methods for primary data include questionnaires, observations made without controlling the situation, interviews between a researcher and participant, and surveys administered through enumerators. Secondary data comes from published sources like government documents and unpublished sources from individuals and organizations.
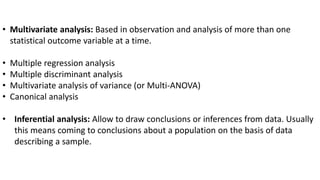
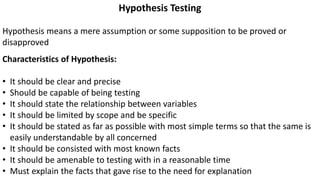
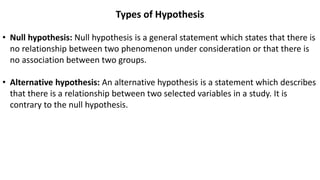
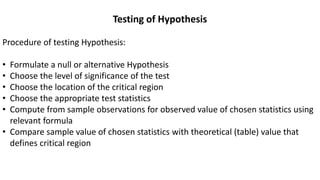
After collection, data must be processed which includes editing, coding, classification, and tabulation to organize it for analysis. Different types of analysis are then used like descriptive, correlation, multivariate, and inferential analysis. Hypotheses are