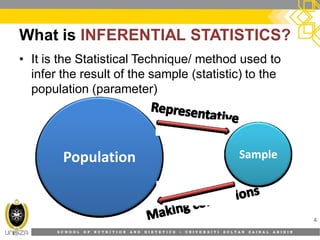
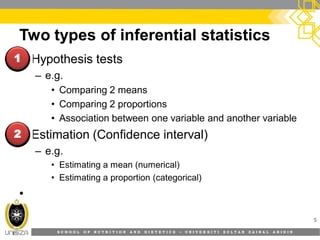
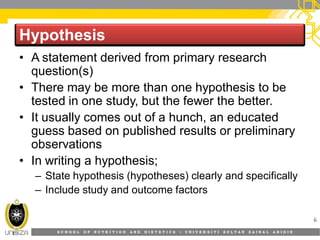
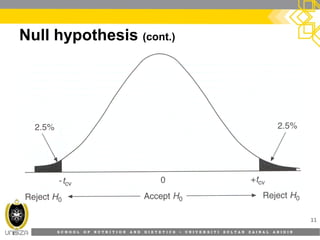
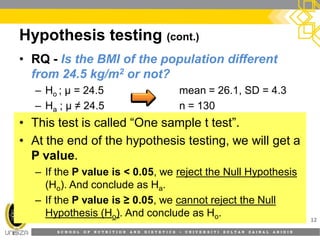
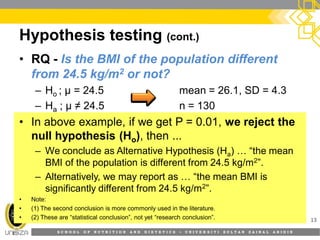
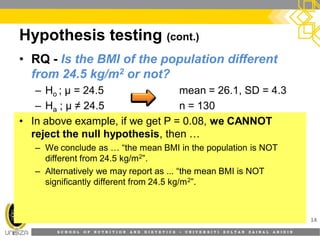
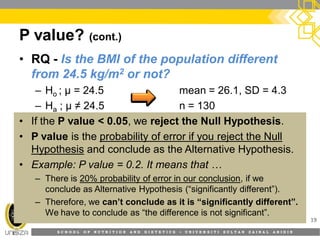
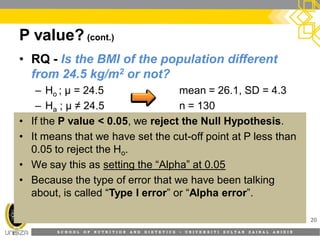
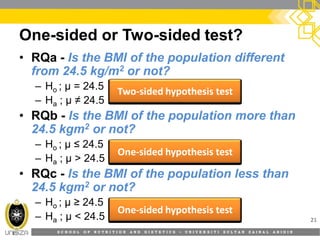
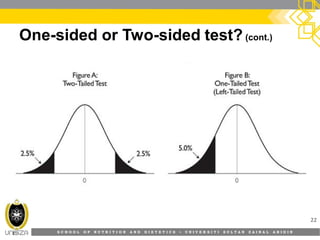
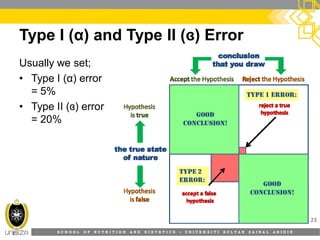
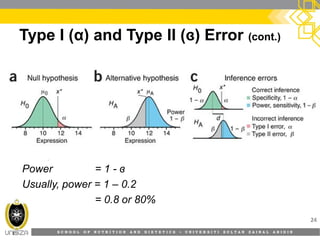
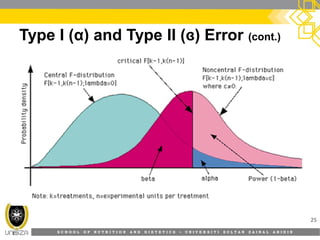
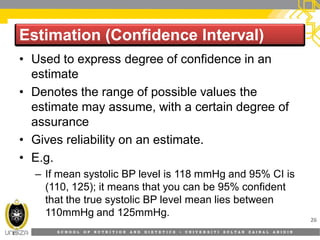
SlideShare a Scribd company logo
KNOWLEDGE FOR THE BENEFIT OF HUMANITYKNOWLEDGE FOR THE BENEFIT OF HUMANITY
BIOSTATISTICS (HFS3283)
INFERENTIAL STATISTICS
Dr.Dr. MohdMohd RazifRazif ShahrilShahril
School of Nutrition & DieteticsSchool of Nutrition & Dietetics
Faculty of Health SciencesFaculty of Health Sciences
UniversitiUniversiti SultanSultan ZainalZainal AbidinAbidin
1
S C H O O L O F N U T R I T I O N A N D D I E T E T I C S • U N I V E R S I T I S U L T A N Z A I N A L A B I D I N
Topic Learning Outcomes
At the end of this lecture, students should be able to;
• define inferential statistics.
• explain hypothesis tests, p value and type I and II error
• explain how to interpret confidence interval
2
S C H O O L O F N U T R I T I O N A N D D I E T E T I C S • U N I V E R S I T I S U L T A N Z A I N A L A B I D I N
3
S C H O O L O F N U T R I T I O N A N D D I E T E T I C S • U N I V E R S I T I S U L T A N Z A I N A L A B I D I N
What is INFERENTIAL STATISTICS?
4
• It is the Statistical Technique/ method used to
infer the result of the sample (statistic) to the
population (parameter)
PopulationPopulation SampleSample
S C H O O L O F N U T R I T I O N A N D D I E T E T I C S • U N I V E R S I T I S U L T A N Z A I N A L A B I D I N
Two types of inferential statistics
5
• Hypothesis tests
– e.g.
• Comparing 2 means
• Comparing 2 proportions
• Association between one variable and another variable
• Estimation (Confidence interval)
– e.g.
• Estimating a mean (numerical)
• Estimating a proportion (categorical)
•
1
2
S C H O O L O F N U T R I T I O N A N D D I E T E T I C S • U N I V E R S I T I S U L T A N Z A I N A L A B I D I N
HypothesisHypothesis
6
• A statement derived from primary research
question(s)
• There may be more than one hypothesis to be
tested in one study, but the fewer the better.
• It usually comes out of a hunch, an educated
guess based on published results or preliminary
observations
• In writing a hypothesis;
– State hypothesis (hypotheses) clearly and specifically
– Include study and outcome factors
•
S C H O O L O F N U T R I T I O N A N D D I E T E T I C S • U N I V E R S I T I S U L T A N Z A I N A L A B I D I N
Research question??
7
• A statement derived from primary research
question(s)
• Most studies are concerned with answering the
following questions:
– What is the magnitude of a health problem or health
factor?
– What is the causal relation between one factor (or
factors) and the disease or outcome of interest?
– What is the efficacy of an intervention?
•
S C H O O L O F N U T R I T I O N A N D D I E T E T I C S • U N I V E R S I T I S U L T A N Z A I N A L A B I D I N
Hypothesis testing
8
• In Hypothesis testing, we answer to a specific
question related to a population parameter (e.g.
population mean nutrition knowledge score)
using a sample statistic (e.g. sample mean
nutrition knowledge score).
S C H O O L O F N U T R I T I O N A N D D I E T E T I C S • U N I V E R S I T I S U L T A N Z A I N A L A B I D I N
Hypothesis testing
9
• In Hypothesis testing, we answer to a specific
question related to a population parameter (e.g.
population mean BMI) using a sample statistic
(e.g. sample mean BMI).
• RQ – Is the BMI of the population different
from 24.5 kg/m2 or not?
• Answer – Yes or No
– Null hypothesis (Ho ; µ = 24.5)
– Alternate hypothesis (Ha ; µ ≠ 24.5)
S C H O O L O F N U T R I T I O N A N D D I E T E T I C S • U N I V E R S I T I S U L T A N Z A I N A L A B I D I N
Null hypothesis
10
• Is a mathematical statement of equality stated
before data collection or data analysis
• After statistical analysis, a p value is calculated.
• Based on this p value, decision is made to
either accept or reject the Ho.
S C H O O L O F N U T R I T I O N A N D D I E T E T I C S • U N I V E R S I T I S U L T A N Z A I N A L A B I D I N
Null hypothesis (cont.)
11
S C H O O L O F N U T R I T I O N A N D D I E T E T I C S • U N I V E R S I T I S U L T A N Z A I N A L A B I D I N
Hypothesis testing (cont.)
12
• RQ - Is the BMI of the population different
from 24.5 kg/m2 or not?
– Ho ; µ = 24.5 mean = 26.1, SD = 4.3
– Ha ; µ ≠ 24.5 n = 130
• This test is called “One sample t test”.
• At the end of the hypothesis testing, we will get a
P value.
– If the P value is < 0.05, we reject the Null Hypothesis
(Ho). And conclude as Ha.
– If the P value is ≥ 0.05, we cannot reject the Null
Hypothesis (Ho). And conclude as Ho.
S C H O O L O F N U T R I T I O N A N D D I E T E T I C S • U N I V E R S I T I S U L T A N Z A I N A L A B I D I N
Hypothesis testing (cont.)
13
• RQ - Is the BMI of the population different
from 24.5 kg/m2 or not?
– Ho ; µ = 24.5 mean = 26.1, SD = 4.3
– Ha ; µ ≠ 24.5 n = 130
• In above example, if we get P = 0.01, we reject the
null hypothesis (Ho), then ...
– We conclude as Alternative Hypothesis (Ha) … “the mean
BMI of the population is different from 24.5 kg/m2”.
– Alternatively, we may report as … “the mean BMI is
significantly different from 24.5 kg/m2”.
• Note:
• (1) The second conclusion is more commonly used in the literature.
• (2) These are “statistical conclusion”, not yet “research conclusion”.
S C H O O L O F N U T R I T I O N A N D D I E T E T I C S • U N I V E R S I T I S U L T A N Z A I N A L A B I D I N
Hypothesis testing (cont.)
14
• RQ - Is the BMI of the population different
from 24.5 kg/m2 or not?
– Ho ; µ = 24.5 mean = 26.1, SD = 4.3
– Ha ; µ ≠ 24.5 n = 130
• In above example, if we get P = 0.08, we CANNOT
reject the null hypothesis, then …
– We conclude as … “the mean BMI in the population is NOT
different from 24.5 kg/m2”.
– Alternatively we may report as ... “the mean BMI is NOT
significantly different from 24.5 kg/m2”.
S C H O O L O F N U T R I T I O N A N D D I E T E T I C S • U N I V E R S I T I S U L T A N Z A I N A L A B I D I N
Hypothesis testing (cont.)
15
• RQ - Is the BMI of the population different
from 24.5 kg/m2 or not?
– Ho ; µ = 24.5 mean = 26.1, SD = 4.3
– Ha ; µ ≠ 24.5 n = 130
• In this one sample t test, there are assumptions or
requirements that we need to fulfil/check.
– (1) The sample is selected by using random sampling.
– (2) Observations are independent.
– (3) The data is “normally distributed” (called “Normality
Assumption”).
S C H O O L O F N U T R I T I O N A N D D I E T E T I C S • U N I V E R S I T I S U L T A N Z A I N A L A B I D I N
Steps in Hypothesis Testing
16
Step (1):Step (1): Generate null and alternative hypothesis
Step (2):Step (2): Set the significance level (α)
Step (3):Step (3): Decide which statistical test to use and check
the assumptions of the test
Step (4):Step (4): Perform test statistic and associated p -value
Step (5):Step (5): Make interpretation (based on p value & CI)
Step (6):Step (6): Draw conclusion
S C H O O L O F N U T R I T I O N A N D D I E T E T I C S • U N I V E R S I T I S U L T A N Z A I N A L A B I D I N
P value?
17
• The p value is the probability (likehood) that the
result or difference was due to chance.
• A p value of 0.05 indicates that a 5% probability
that the difference observed between the groups
was due to chance
S C H O O L O F N U T R I T I O N A N D D I E T E T I C S • U N I V E R S I T I S U L T A N Z A I N A L A B I D I N
P value? (cont.)
18
• RQ - Is the BMI of the population different
from 24.5 kg/m2 or not?
– Ho ; µ = 24.5 mean = 26.1, SD = 4.3
– Ha ; µ ≠ 24.5 n = 130
• If the P value < 0.05, we reject the Null Hypothesis.
• P value is the probability of error if you reject the Null
Hypothesis and conclude as the Alternative Hypothesis.
• Example: P value = 0.01. It means that …
– There is 1% probability of error in our conclusion, if we conclude
as Alternative Hypothesis (“significantly different”).
– We normally, allow less than 5% error. That is why the cut-off
point for P value is 0.05.
S C H O O L O F N U T R I T I O N A N D D I E T E T I C S • U N I V E R S I T I S U L T A N Z A I N A L A B I D I N
P value? (cont.)
19
• RQ - Is the BMI of the population different
from 24.5 kg/m2 or not?
– Ho ; µ = 24.5 mean = 26.1, SD = 4.3
– Ha ; µ ≠ 24.5 n = 130
• If the P value < 0.05, we reject the Null Hypothesis.
• P value is the probability of error if you reject the Null
Hypothesis and conclude as the Alternative Hypothesis.
• Example: P value = 0.2. It means that …
– There is 20% probability of error in our conclusion, if we
conclude as Alternative Hypothesis (“significantly different”).
– Therefore, we can’t conclude as it is “significantly different”.
We have to conclude as “the difference is not significant”.
S C H O O L O F N U T R I T I O N A N D D I E T E T I C S • U N I V E R S I T I S U L T A N Z A I N A L A B I D I N
P value? (cont.)
20
• RQ - Is the BMI of the population different
from 24.5 kg/m2 or not?
– Ho ; µ = 24.5 mean = 26.1, SD = 4.3
– Ha ; µ ≠ 24.5 n = 130
• If the P value < 0.05, we reject the Null Hypothesis.
• It means that we have set the cut-off point at P less than
0.05 to reject the Ho.
• We say this as setting the “Alpha” at 0.05
• Because the type of error that we have been talking
about, is called “Type I error” or “Alpha error”.
S C H O O L O F N U T R I T I O N A N D D I E T E T I C S • U N I V E R S I T I S U L T A N Z A I N A L A B I D I N
One-sided or Two-sided test?
21
• RQa - Is the BMI of the population different
from 24.5 kg/m2 or not?
– Ho ; µ = 24.5
– Ha ; µ ≠ 24.5
• RQb - Is the BMI of the population more than
24.5 kgm2 or not?
– Ho ; µ ≤ 24.5
– Ha ; µ > 24.5
• RQc - Is the BMI of the population less than
24.5 kgm2 or not?
– Ho ; µ ≥ 24.5
– Ha ; µ < 24.5
TwoTwo--sided hypothesis testsided hypothesis test
OneOne--sided hypothesis testsided hypothesis test
S C H O O L O F N U T R I T I O N A N D D I E T E T I C S • U N I V E R S I T I S U L T A N Z A I N A L A B I D I N
One-sided or Two-sided test? (cont.)
22
S C H O O L O F N U T R I T I O N A N D D I E T E T I C S • U N I V E R S I T I S U L T A N Z A I N A L A B I D I N
Type I (α) and Type II (ɞ) Error
23
Usually we set;
• Type I (α) error
= 5%
• Type II (ɞ) error
= 20%
S C H O O L O F N U T R I T I O N A N D D I E T E T I C S • U N I V E R S I T I S U L T A N Z A I N A L A B I D I N
Type I (α) and Type II (ɞ) Error (cont.)
24
Power = 1 - ɞ
Usually, power = 1 – 0.2
= 0.8 or 80%
S C H O O L O F N U T R I T I O N A N D D I E T E T I C S • U N I V E R S I T I S U L T A N Z A I N A L A B I D I N
Type I (α) and Type II (ɞ) Error (cont.)
25
S C H O O L O F N U T R I T I O N A N D D I E T E T I C S • U N I V E R S I T I S U L T A N Z A I N A L A B I D I N
Estimation (Confidence Interval)Estimation (Confidence Interval)
26
• Used to express degree of confidence in an
estimate
• Denotes the range of possible values the
estimate may assume, with a certain degree of
assurance
• Gives reliability on an estimate.
• E.g.
– If mean systolic BP level is 118 mmHg and 95% CI is
(110, 125); it means that you can be 95% confident
that the true systolic BP level mean lies between
110mmHg and 125mmHg.
S C H O O L O F N U T R I T I O N A N D D I E T E T I C S • U N I V E R S I T I S U L T A N Z A I N A L A B I D I N
Estimation a Mean
27
• Formula = mean ± (t α/2 x SE)
• Calculation example;
– The systolic BP of 100 students in a class
Mean = 123.4 mmHg
SD = 14.0 mmHg
– The 95% CI = Mean ± t α/2 x (SD/√n)
= 123.4 ± (1.98 x 14/10)
– The 95% CI ranges from 120.6 mmHg to 126.2 mmHg
– We can be 95% sure that this range includes the true
population mean.
•
S C H O O L O F N U T R I T I O N A N D D I E T E T I C S • U N I V E R S I T I S U L T A N Z A I N A L A B I D I N
Assumption or Requirement
28
Calculation can be made only ...
1) When the sample is selected by using random
sampling
2) When the observations are independent
3) When the data is “normally distributed” (called
“Normality Assumption”)
S C H O O L O F N U T R I T I O N A N D D I E T E T I C S • U N I V E R S I T I S U L T A N Z A I N A L A B I D I N
Estimation a Proportion
29
• Formula = p ± (Z α/2 x SE)
• Calculation example;
– The abnormal systolic BP of 100 students in a class
Prevalence = 37%
– The 95% CI = p ± (Z α/2 x SE)
= 0.37 ± (1.96 x √((0.37*0.63)/100)
– The 95% CI ranges from 0.27 to 0.47 (or 27% to
47%)
– We can be 95% sure that this range includes the
true population proportion.
•
S C H O O L O F N U T R I T I O N A N D D I E T E T I C S • U N I V E R S I T I S U L T A N Z A I N A L A B I D I N
Assumption or Requirement
30
Calculation can be made only ...
1) When the sample is selected by using random
sampling
2) When the observations are independent
3) BOTH (n*p) and (n *(1-p)) must be more than 5
count.
Note:
• Recode into 0 and 1;
– 1 should be ‘disease’ or condition of interest.
– 0 should be ‘non-disease’ or the rest.
S C H O O L O F N U T R I T I O N A N D D I E T E T I C S • U N I V E R S I T I S U L T A N Z A I N A L A B I D I N
P value and Confidence Interval
31
• When using statistics to compare 2 groups, 2
approaches can be used;
– Calculation of p value
– Calculation of confidence interval
• Both p values and confidence interval are
complimentary and should be used together.
S C H O O L O F N U T R I T I O N A N D D I E T E T I C S • U N I V E R S I T I S U L T A N Z A I N A L A B I D I N
Limitation of P value
32
• p values are sensitive to sample size
– Large sample size, smaller p value
• p values are sensitive to the magnitude of
difference between the two group:
– If the difference is small but samples are large, results
can still be statistically significant
– If the difference is large but samples are small, result
would not be statistically significant
Thank YouThank You
33

More Related Content

What's hot

Inferential statictis ready go
Inferential statictis ready goInferential statictis ready go
Inferential statictis ready go
Mmedsc Hahm
 
Chapter 7 sampling distributions
Chapter 7 sampling distributionsChapter 7 sampling distributions
Chapter 7 sampling distributions
meharahutsham
 
Statistical inference concept, procedure of hypothesis testing
Statistical inference   concept, procedure of hypothesis testingStatistical inference   concept, procedure of hypothesis testing
Statistical inference concept, procedure of hypothesis testing
AmitaChaudhary19
 
Parametric vs non parametric test
Parametric vs non parametric testParametric vs non parametric test
Parametric vs non parametric test
ar9530
 
Inferential Statistics
Inferential StatisticsInferential Statistics
Inferential Statistics
Kush Kulshrestha
 
T test
T testT test
Hypothesis Testing
Hypothesis TestingHypothesis Testing
Hypothesis Testing
Birinder Singh Gulati
 
Statistical tests
Statistical testsStatistical tests
Statistical tests
martyynyyte
 
Lecture 5: Interval Estimation
Lecture 5: Interval Estimation Lecture 5: Interval Estimation
Lecture 5: Interval Estimation
Marina Santini
 
Testing for normality
Testing for normalityTesting for normality
Testing for normality
Dr. Ankita Srivastava
 
descriptive and inferential statistics
descriptive and inferential statisticsdescriptive and inferential statistics
descriptive and inferential statistics
Mona Sajid
 
Lecture 6. univariate and bivariate analysis
Lecture 6. univariate and bivariate analysisLecture 6. univariate and bivariate analysis
Lecture 6. univariate and bivariate analysis
Dr Rajeev Kumar
 
Stat 3203 -sampling errors and non-sampling errors
Stat 3203 -sampling errors  and non-sampling errorsStat 3203 -sampling errors  and non-sampling errors
Stat 3203 -sampling errors and non-sampling errors
Khulna University
 
TREATMENT OF DATA_Scrd.pptx
TREATMENT OF DATA_Scrd.pptxTREATMENT OF DATA_Scrd.pptx
TREATMENT OF DATA_Scrd.pptx
Carmela857185
 
Hypothesis testing
Hypothesis testingHypothesis testing
Hypothesis testing
Arnab Sadhu
 
Parametric vs Nonparametric Tests: When to use which
Parametric vs Nonparametric Tests: When to use whichParametric vs Nonparametric Tests: When to use which
Parametric vs Nonparametric Tests: When to use which
Gönenç Dalgıç
 
Non parametric-tests
Non parametric-testsNon parametric-tests
Non parametric-tests
Asmita Bhagdikar
 
t test using spss
t test using spsst test using spss
t test using spss
Parag Shah
 
Hypothesis
HypothesisHypothesis
Hypothesis
jyotsna dwivedi
 
Standerdization
StanderdizationStanderdization
Standerdization
Kunal Modak
 

What's hot (20)

Inferential statictis ready go
Inferential statictis ready goInferential statictis ready go
Inferential statictis ready go
 
Chapter 7 sampling distributions
Chapter 7 sampling distributionsChapter 7 sampling distributions
Chapter 7 sampling distributions
 
Statistical inference concept, procedure of hypothesis testing
Statistical inference   concept, procedure of hypothesis testingStatistical inference   concept, procedure of hypothesis testing
Statistical inference concept, procedure of hypothesis testing
 
Parametric vs non parametric test
Parametric vs non parametric testParametric vs non parametric test
Parametric vs non parametric test
 
Inferential Statistics
Inferential StatisticsInferential Statistics
Inferential Statistics
 
T test
T testT test
T test
 
Hypothesis Testing
Hypothesis TestingHypothesis Testing
Hypothesis Testing
 
Statistical tests
Statistical testsStatistical tests
Statistical tests
 
Lecture 5: Interval Estimation
Lecture 5: Interval Estimation Lecture 5: Interval Estimation
Lecture 5: Interval Estimation
 
Testing for normality
Testing for normalityTesting for normality
Testing for normality
 
descriptive and inferential statistics
descriptive and inferential statisticsdescriptive and inferential statistics
descriptive and inferential statistics
 
Lecture 6. univariate and bivariate analysis
Lecture 6. univariate and bivariate analysisLecture 6. univariate and bivariate analysis
Lecture 6. univariate and bivariate analysis
 
Stat 3203 -sampling errors and non-sampling errors
Stat 3203 -sampling errors  and non-sampling errorsStat 3203 -sampling errors  and non-sampling errors
Stat 3203 -sampling errors and non-sampling errors
 
TREATMENT OF DATA_Scrd.pptx
TREATMENT OF DATA_Scrd.pptxTREATMENT OF DATA_Scrd.pptx
TREATMENT OF DATA_Scrd.pptx
 
Hypothesis testing
Hypothesis testingHypothesis testing
Hypothesis testing
 
Parametric vs Nonparametric Tests: When to use which
Parametric vs Nonparametric Tests: When to use whichParametric vs Nonparametric Tests: When to use which
Parametric vs Nonparametric Tests: When to use which
 
Non parametric-tests
Non parametric-testsNon parametric-tests
Non parametric-tests
 
t test using spss
t test using spsst test using spss
t test using spss
 
Hypothesis
HypothesisHypothesis
Hypothesis
 
Standerdization
StanderdizationStanderdization
Standerdization
 

Viewers also liked

6. Categorical data analysis - Chi-Square & Fisher Exact Test
6. Categorical data analysis - Chi-Square & Fisher Exact Test6. Categorical data analysis - Chi-Square & Fisher Exact Test
6. Categorical data analysis - Chi-Square & Fisher Exact Test
Razif Shahril
 
5. Non parametric analysis
5. Non parametric analysis5. Non parametric analysis
5. Non parametric analysis
Razif Shahril
 
8. Correlation
8. Correlation8. Correlation
8. Correlation
Razif Shahril
 
1. Introduction to biostatistics
1. Introduction to biostatistics1. Introduction to biostatistics
1. Introduction to biostatistics
Razif Shahril
 
HFS3283 paired t tes-t and anova
HFS3283 paired t tes-t and anovaHFS3283 paired t tes-t and anova
HFS3283 paired t tes-t and anova
wajihahwafa
 
NDD10603
NDD10603 NDD10603
NDD10603
wajihahwafa
 
Scientific writing
Scientific writingScientific writing
Scientific writing
Razif Shahril
 
4. Cohort
4. Cohort4. Cohort
4. Cohort
Razif Shahril
 
1. Prelude + Introduction to Research Methodology
1. Prelude +  Introduction to Research Methodology1. Prelude +  Introduction to Research Methodology
1. Prelude + Introduction to Research Methodology
Razif Shahril
 
Research Design
Research DesignResearch Design
Research Design
Angel Rose
 
11. Processing and displaying data
11. Processing and displaying data11. Processing and displaying data
11. Processing and displaying data
Razif Shahril
 
3. Reviewing the literature
3. Reviewing the literature3. Reviewing the literature
3. Reviewing the literature
Razif Shahril
 
4 Literature Search Techniques 2 Strategic Searching
4 Literature Search Techniques 2 Strategic Searching4 Literature Search Techniques 2 Strategic Searching
4 Literature Search Techniques 2 Strategic Searching
richard kemp
 
6. Selecting a study design
6. Selecting a study design6. Selecting a study design
6. Selecting a study design
Razif Shahril
 
Searching the Literature: Search Techniques and Construction
Searching the Literature: Search Techniques and ConstructionSearching the Literature: Search Techniques and Construction
Searching the Literature: Search Techniques and Construction
University of Michigan Taubman Health Sciences Library
 
Non Parametric Tests
Non Parametric TestsNon Parametric Tests
Non Parametric Tests
Neeraj Kaushik
 
Chi-square, Yates, Fisher & McNemar
Chi-square, Yates, Fisher & McNemarChi-square, Yates, Fisher & McNemar
Chi-square, Yates, Fisher & McNemar
Azmi Mohd Tamil
 
RESEARCH METHODOLOGY- PROCESSING OF DATA
RESEARCH METHODOLOGY- PROCESSING OF DATARESEARCH METHODOLOGY- PROCESSING OF DATA
RESEARCH METHODOLOGY- PROCESSING OF DATA
jeni jerry
 
HFS 3283 independent t test
HFS 3283 independent t testHFS 3283 independent t test
HFS 3283 independent t test
wajihahwafa
 
How to Conduct a Systematic Search in PubMed
How to Conduct a Systematic Search in PubMedHow to Conduct a Systematic Search in PubMed
How to Conduct a Systematic Search in PubMed
Robin Featherstone
 

Viewers also liked (20)

6. Categorical data analysis - Chi-Square & Fisher Exact Test
6. Categorical data analysis - Chi-Square & Fisher Exact Test6. Categorical data analysis - Chi-Square & Fisher Exact Test
6. Categorical data analysis - Chi-Square & Fisher Exact Test
 
5. Non parametric analysis
5. Non parametric analysis5. Non parametric analysis
5. Non parametric analysis
 
8. Correlation
8. Correlation8. Correlation
8. Correlation
 
1. Introduction to biostatistics
1. Introduction to biostatistics1. Introduction to biostatistics
1. Introduction to biostatistics
 
HFS3283 paired t tes-t and anova
HFS3283 paired t tes-t and anovaHFS3283 paired t tes-t and anova
HFS3283 paired t tes-t and anova
 
NDD10603
NDD10603 NDD10603
NDD10603
 
Scientific writing
Scientific writingScientific writing
Scientific writing
 
4. Cohort
4. Cohort4. Cohort
4. Cohort
 
1. Prelude + Introduction to Research Methodology
1. Prelude +  Introduction to Research Methodology1. Prelude +  Introduction to Research Methodology
1. Prelude + Introduction to Research Methodology
 
Research Design
Research DesignResearch Design
Research Design
 
11. Processing and displaying data
11. Processing and displaying data11. Processing and displaying data
11. Processing and displaying data
 
3. Reviewing the literature
3. Reviewing the literature3. Reviewing the literature
3. Reviewing the literature
 
4 Literature Search Techniques 2 Strategic Searching
4 Literature Search Techniques 2 Strategic Searching4 Literature Search Techniques 2 Strategic Searching
4 Literature Search Techniques 2 Strategic Searching
 
6. Selecting a study design
6. Selecting a study design6. Selecting a study design
6. Selecting a study design
 
Searching the Literature: Search Techniques and Construction
Searching the Literature: Search Techniques and ConstructionSearching the Literature: Search Techniques and Construction
Searching the Literature: Search Techniques and Construction
 
Non Parametric Tests
Non Parametric TestsNon Parametric Tests
Non Parametric Tests
 
Chi-square, Yates, Fisher & McNemar
Chi-square, Yates, Fisher & McNemarChi-square, Yates, Fisher & McNemar
Chi-square, Yates, Fisher & McNemar
 
RESEARCH METHODOLOGY- PROCESSING OF DATA
RESEARCH METHODOLOGY- PROCESSING OF DATARESEARCH METHODOLOGY- PROCESSING OF DATA
RESEARCH METHODOLOGY- PROCESSING OF DATA
 
HFS 3283 independent t test
HFS 3283 independent t testHFS 3283 independent t test
HFS 3283 independent t test
 
How to Conduct a Systematic Search in PubMed
How to Conduct a Systematic Search in PubMedHow to Conduct a Systematic Search in PubMed
How to Conduct a Systematic Search in PubMed
 

Similar to 2. Inferential statistics

Malimu statistical significance testing.
Malimu statistical significance testing.Malimu statistical significance testing.
Malimu statistical significance testing.
Miharbi Ignasm
 
Test of significance
Test of significanceTest of significance
Test of significance
Dr Bushra Jabeen
 
Statistics basics for oncologist kiran
Statistics basics for oncologist kiranStatistics basics for oncologist kiran
Statistics basics for oncologist kiran
Kiran Ramakrishna
 
Lecture 7 Hypothesis testing.pptx
Lecture 7 Hypothesis testing.pptxLecture 7 Hypothesis testing.pptx
Lecture 7 Hypothesis testing.pptx
shakirRahman10
 
Basics of Statistics.pptx
Basics of Statistics.pptxBasics of Statistics.pptx
Basics of Statistics.pptx
Ammar Sami AL-Bayati
 
ChandanChakrabarty_1.pdf
ChandanChakrabarty_1.pdfChandanChakrabarty_1.pdf
ChandanChakrabarty_1.pdf
Dikshathawait
 
Application of statistical tests in Biomedical Research .pptx
Application of statistical tests in Biomedical Research .pptxApplication of statistical tests in Biomedical Research .pptx
Application of statistical tests in Biomedical Research .pptx
Halim AS
 
Class 5 Hypothesis & Normal Disdribution.pptx
Class 5 Hypothesis & Normal Disdribution.pptxClass 5 Hypothesis & Normal Disdribution.pptx
Class 5 Hypothesis & Normal Disdribution.pptx
CallplanetsDeveloper
 
Chapter 15 Marketing Research Malhotra
Chapter 15 Marketing Research MalhotraChapter 15 Marketing Research Malhotra
Chapter 15 Marketing Research Malhotra
AADITYA TANTIA
 
Basics of Hypothesis testing for Pharmacy
Basics of Hypothesis testing for PharmacyBasics of Hypothesis testing for Pharmacy
Basics of Hypothesis testing for Pharmacy
Parag Shah
 
Intro to tests of significance qualitative
Intro to tests of significance qualitativeIntro to tests of significance qualitative
Intro to tests of significance qualitative
Pandurangi Raghavendra
 
hypothesis testing-tests of proportions and variances in six sigma
hypothesis testing-tests of proportions and variances in six sigmahypothesis testing-tests of proportions and variances in six sigma
hypothesis testing-tests of proportions and variances in six sigma
vdheerajk
 
Hypothesis testing1
Hypothesis testing1Hypothesis testing1
Hypothesis testing1
HanaaBayomy
 
Causal Inference in Data Science and Machine Learning
Causal Inference in Data Science and Machine LearningCausal Inference in Data Science and Machine Learning
Causal Inference in Data Science and Machine Learning
Bill Liu
 
Test hypothesis & p-value
Test hypothesis & p-valueTest hypothesis & p-value
Test hypothesis & p-value
Raeesa Mukhtar
 
Overview of statistics: Statistical testing (Part I)
Overview of statistics: Statistical testing (Part I)Overview of statistics: Statistical testing (Part I)
Overview of statistics: Statistical testing (Part I)
Bioinformatics and Computational Biosciences Branch
 
Chapter 4(1) Basic Logic
Chapter 4(1) Basic LogicChapter 4(1) Basic Logic
Chapter 4(1) Basic Logic
Sumit Prajapati
 
Chapter 4(1) Basic Logic
Chapter 4(1) Basic LogicChapter 4(1) Basic Logic
Chapter 4(1) Basic Logic
Sumit Prajapati
 
Test of-significance : Z test , Chi square test
Test of-significance : Z test , Chi square testTest of-significance : Z test , Chi square test
Test of-significance : Z test , Chi square test
dr.balan shaikh
 
Lecture2 hypothesis testing
Lecture2 hypothesis testingLecture2 hypothesis testing
Lecture2 hypothesis testing
o_devinyak
 

Similar to 2. Inferential statistics (20)

Malimu statistical significance testing.
Malimu statistical significance testing.Malimu statistical significance testing.
Malimu statistical significance testing.
 
Test of significance
Test of significanceTest of significance
Test of significance
 
Statistics basics for oncologist kiran
Statistics basics for oncologist kiranStatistics basics for oncologist kiran
Statistics basics for oncologist kiran
 
Lecture 7 Hypothesis testing.pptx
Lecture 7 Hypothesis testing.pptxLecture 7 Hypothesis testing.pptx
Lecture 7 Hypothesis testing.pptx
 
Basics of Statistics.pptx
Basics of Statistics.pptxBasics of Statistics.pptx
Basics of Statistics.pptx
 
ChandanChakrabarty_1.pdf
ChandanChakrabarty_1.pdfChandanChakrabarty_1.pdf
ChandanChakrabarty_1.pdf
 
Application of statistical tests in Biomedical Research .pptx
Application of statistical tests in Biomedical Research .pptxApplication of statistical tests in Biomedical Research .pptx
Application of statistical tests in Biomedical Research .pptx
 
Class 5 Hypothesis & Normal Disdribution.pptx
Class 5 Hypothesis & Normal Disdribution.pptxClass 5 Hypothesis & Normal Disdribution.pptx
Class 5 Hypothesis & Normal Disdribution.pptx
 
Chapter 15 Marketing Research Malhotra
Chapter 15 Marketing Research MalhotraChapter 15 Marketing Research Malhotra
Chapter 15 Marketing Research Malhotra
 
Basics of Hypothesis testing for Pharmacy
Basics of Hypothesis testing for PharmacyBasics of Hypothesis testing for Pharmacy
Basics of Hypothesis testing for Pharmacy
 
Intro to tests of significance qualitative
Intro to tests of significance qualitativeIntro to tests of significance qualitative
Intro to tests of significance qualitative
 
hypothesis testing-tests of proportions and variances in six sigma
hypothesis testing-tests of proportions and variances in six sigmahypothesis testing-tests of proportions and variances in six sigma
hypothesis testing-tests of proportions and variances in six sigma
 
Hypothesis testing1
Hypothesis testing1Hypothesis testing1
Hypothesis testing1
 
Causal Inference in Data Science and Machine Learning
Causal Inference in Data Science and Machine LearningCausal Inference in Data Science and Machine Learning
Causal Inference in Data Science and Machine Learning
 
Test hypothesis & p-value
Test hypothesis & p-valueTest hypothesis & p-value
Test hypothesis & p-value
 
Overview of statistics: Statistical testing (Part I)
Overview of statistics: Statistical testing (Part I)Overview of statistics: Statistical testing (Part I)
Overview of statistics: Statistical testing (Part I)
 
Chapter 4(1) Basic Logic
Chapter 4(1) Basic LogicChapter 4(1) Basic Logic
Chapter 4(1) Basic Logic
 
Chapter 4(1) Basic Logic
Chapter 4(1) Basic LogicChapter 4(1) Basic Logic
Chapter 4(1) Basic Logic
 
Test of-significance : Z test , Chi square test
Test of-significance : Z test , Chi square testTest of-significance : Z test , Chi square test
Test of-significance : Z test , Chi square test
 
Lecture2 hypothesis testing
Lecture2 hypothesis testingLecture2 hypothesis testing
Lecture2 hypothesis testing
 

More from Razif Shahril

10. Ethical issues
10. Ethical issues10. Ethical issues
10. Ethical issues
Razif Shahril
 
9. Selecting a sample
9. Selecting a sample9. Selecting a sample
9. Selecting a sample
Razif Shahril
 
8. validity and reliability of research instruments
8. validity and reliability of research instruments8. validity and reliability of research instruments
8. validity and reliability of research instruments
Razif Shahril
 
8. Preparing the report
8. Preparing the report8. Preparing the report
8. Preparing the report
Razif Shahril
 
7. Selecting a data collection method
7. Selecting a data collection method7. Selecting a data collection method
7. Selecting a data collection method
Razif Shahril
 
5. Identifying variables and constructing hypothesis
5. Identifying variables and constructing hypothesis5. Identifying variables and constructing hypothesis
5. Identifying variables and constructing hypothesis
Razif Shahril
 
4. Formulating research problems
4. Formulating research problems4. Formulating research problems
4. Formulating research problems
Razif Shahril
 
5. Case control
5. Case control5. Case control
5. Case control
Razif Shahril
 
6. Randomised controlled trial
6. Randomised controlled trial6. Randomised controlled trial
6. Randomised controlled trial
Razif Shahril
 
3. Cross sectional
3. Cross sectional3. Cross sectional
3. Cross sectional
Razif Shahril
 
2. Case study and case series
2. Case study and case series2. Case study and case series
2. Case study and case series
Razif Shahril
 
1. Introduction to epidemiological study designs
1. Introduction to epidemiological study designs1. Introduction to epidemiological study designs
1. Introduction to epidemiological study designs
Razif Shahril
 
6. Glycemic index
6. Glycemic index6. Glycemic index
6. Glycemic index
Razif Shahril
 
5. Nutrition in emergencies
5. Nutrition in emergencies5. Nutrition in emergencies
5. Nutrition in emergencies
Razif Shahril
 
4. World Hunger
4. World Hunger4. World Hunger
4. World Hunger
Razif Shahril
 
Food Irradiation
Food IrradiationFood Irradiation
Food Irradiation
Razif Shahril
 
Obesity
ObesityObesity
Obesity
Razif Shahril
 
Introduction HFS4352
Introduction HFS4352Introduction HFS4352
Introduction HFS4352
Razif Shahril
 
Developing a Food Frequency Questionnaire
Developing a Food Frequency QuestionnaireDeveloping a Food Frequency Questionnaire
Developing a Food Frequency Questionnaire
Razif Shahril
 

More from Razif Shahril (19)

10. Ethical issues
10. Ethical issues10. Ethical issues
10. Ethical issues
 
9. Selecting a sample
9. Selecting a sample9. Selecting a sample
9. Selecting a sample
 
8. validity and reliability of research instruments
8. validity and reliability of research instruments8. validity and reliability of research instruments
8. validity and reliability of research instruments
 
8. Preparing the report
8. Preparing the report8. Preparing the report
8. Preparing the report
 
7. Selecting a data collection method
7. Selecting a data collection method7. Selecting a data collection method
7. Selecting a data collection method
 
5. Identifying variables and constructing hypothesis
5. Identifying variables and constructing hypothesis5. Identifying variables and constructing hypothesis
5. Identifying variables and constructing hypothesis
 
4. Formulating research problems
4. Formulating research problems4. Formulating research problems
4. Formulating research problems
 
5. Case control
5. Case control5. Case control
5. Case control
 
6. Randomised controlled trial
6. Randomised controlled trial6. Randomised controlled trial
6. Randomised controlled trial
 
3. Cross sectional
3. Cross sectional3. Cross sectional
3. Cross sectional
 
2. Case study and case series
2. Case study and case series2. Case study and case series
2. Case study and case series
 
1. Introduction to epidemiological study designs
1. Introduction to epidemiological study designs1. Introduction to epidemiological study designs
1. Introduction to epidemiological study designs
 
6. Glycemic index
6. Glycemic index6. Glycemic index
6. Glycemic index
 
5. Nutrition in emergencies
5. Nutrition in emergencies5. Nutrition in emergencies
5. Nutrition in emergencies
 
4. World Hunger
4. World Hunger4. World Hunger
4. World Hunger
 
Food Irradiation
Food IrradiationFood Irradiation
Food Irradiation
 
Obesity
ObesityObesity
Obesity
 
Introduction HFS4352
Introduction HFS4352Introduction HFS4352
Introduction HFS4352
 
Developing a Food Frequency Questionnaire
Developing a Food Frequency QuestionnaireDeveloping a Food Frequency Questionnaire
Developing a Food Frequency Questionnaire
 

Recently uploaded

Complementary feeding in infant IAP PROTOCOLS
Complementary feeding in infant IAP PROTOCOLSComplementary feeding in infant IAP PROTOCOLS
Complementary feeding in infant IAP PROTOCOLS
chiranthgowda16
 
Promoting Wellbeing - Applied Social Psychology - Psychology SuperNotes
Promoting Wellbeing - Applied Social Psychology - Psychology SuperNotesPromoting Wellbeing - Applied Social Psychology - Psychology SuperNotes
Promoting Wellbeing - Applied Social Psychology - Psychology SuperNotes
PsychoTech Services
 
Cell Therapy Expansion and Challenges in Autoimmune Disease
Cell Therapy Expansion and Challenges in Autoimmune DiseaseCell Therapy Expansion and Challenges in Autoimmune Disease
Cell Therapy Expansion and Challenges in Autoimmune Disease
Health Advances
 
Hemodialysis: Chapter 4, Dialysate Circuit - Dr.Gawad
Hemodialysis: Chapter 4, Dialysate Circuit - Dr.GawadHemodialysis: Chapter 4, Dialysate Circuit - Dr.Gawad
Hemodialysis: Chapter 4, Dialysate Circuit - Dr.Gawad
NephroTube - Dr.Gawad
 
CHEMOTHERAPY_RDP_CHAPTER 2 _LEPROSY.pdf1
CHEMOTHERAPY_RDP_CHAPTER 2 _LEPROSY.pdf1CHEMOTHERAPY_RDP_CHAPTER 2 _LEPROSY.pdf1
CHEMOTHERAPY_RDP_CHAPTER 2 _LEPROSY.pdf1
rishi2789
 
Efficacy of Avartana Sneha in Ayurveda
Efficacy of Avartana Sneha in AyurvedaEfficacy of Avartana Sneha in Ayurveda
Efficacy of Avartana Sneha in Ayurveda
Dr. Jyothirmai Paindla
 
CHEMOTHERAPY_RDP_CHAPTER 6_Anti Malarial Drugs.pdf
CHEMOTHERAPY_RDP_CHAPTER 6_Anti Malarial Drugs.pdfCHEMOTHERAPY_RDP_CHAPTER 6_Anti Malarial Drugs.pdf
CHEMOTHERAPY_RDP_CHAPTER 6_Anti Malarial Drugs.pdf
rishi2789
 
Identifying Major Symptoms of Slip Disc.
 Identifying Major Symptoms of Slip Disc. Identifying Major Symptoms of Slip Disc.
Identifying Major Symptoms of Slip Disc.
Gokuldas Hospital
 
Osteoporosis - Definition , Evaluation and Management .pdf
Osteoporosis - Definition , Evaluation and Management .pdfOsteoporosis - Definition , Evaluation and Management .pdf
Osteoporosis - Definition , Evaluation and Management .pdf
Jim Jacob Roy
 
Does Over-Masturbation Contribute to Chronic Prostatitis.pptx
Does Over-Masturbation Contribute to Chronic Prostatitis.pptxDoes Over-Masturbation Contribute to Chronic Prostatitis.pptx
Does Over-Masturbation Contribute to Chronic Prostatitis.pptx
walterHu5
 
NARCOTICS- POLICY AND PROCEDURES FOR ITS USE
NARCOTICS- POLICY AND PROCEDURES FOR ITS USENARCOTICS- POLICY AND PROCEDURES FOR ITS USE
NARCOTICS- POLICY AND PROCEDURES FOR ITS USE
Dr. Ahana Haroon
 
Medical Quiz ( Online Quiz for API Meet 2024 ).pdf
Medical Quiz ( Online Quiz for API Meet 2024 ).pdfMedical Quiz ( Online Quiz for API Meet 2024 ).pdf
Medical Quiz ( Online Quiz for API Meet 2024 ).pdf
Jim Jacob Roy
 
K CỔ TỬ CUNG.pdf tự ghi chép, chữ hơi xấu
K CỔ TỬ CUNG.pdf tự ghi chép, chữ hơi xấuK CỔ TỬ CUNG.pdf tự ghi chép, chữ hơi xấu
K CỔ TỬ CUNG.pdf tự ghi chép, chữ hơi xấu
HongBiThi1
 
Journal Article Review on Rasamanikya
Journal Article Review on RasamanikyaJournal Article Review on Rasamanikya
Journal Article Review on Rasamanikya
Dr. Jyothirmai Paindla
 
Ear and its clinical correlations By Dr. Rabia Inam Gandapore.pptx
Ear and its clinical correlations By Dr. Rabia Inam Gandapore.pptxEar and its clinical correlations By Dr. Rabia Inam Gandapore.pptx
Ear and its clinical correlations By Dr. Rabia Inam Gandapore.pptx
Dr. Rabia Inam Gandapore
 
The Electrocardiogram - Physiologic Principles
The Electrocardiogram - Physiologic PrinciplesThe Electrocardiogram - Physiologic Principles
The Electrocardiogram - Physiologic Principles
MedicoseAcademics
 
Hiranandani Hospital Powai News [Read Now].pdf
Hiranandani Hospital Powai News [Read Now].pdfHiranandani Hospital Powai News [Read Now].pdf
Hiranandani Hospital Powai News [Read Now].pdf
Dr. Sujit Chatterjee CEO Hiranandani Hospital
 
OCT Training Course for clinical practice Part 1
OCT Training Course for clinical practice Part 1OCT Training Course for clinical practice Part 1
OCT Training Course for clinical practice Part 1
KafrELShiekh University
 
CHEMOTHERAPY_RDP_CHAPTER 4_ANTI VIRAL DRUGS.pdf
CHEMOTHERAPY_RDP_CHAPTER 4_ANTI VIRAL DRUGS.pdfCHEMOTHERAPY_RDP_CHAPTER 4_ANTI VIRAL DRUGS.pdf
CHEMOTHERAPY_RDP_CHAPTER 4_ANTI VIRAL DRUGS.pdf
rishi2789
 
CHEMOTHERAPY_RDP_CHAPTER 3_ANTIFUNGAL AGENT.pdf
CHEMOTHERAPY_RDP_CHAPTER 3_ANTIFUNGAL AGENT.pdfCHEMOTHERAPY_RDP_CHAPTER 3_ANTIFUNGAL AGENT.pdf
CHEMOTHERAPY_RDP_CHAPTER 3_ANTIFUNGAL AGENT.pdf
rishi2789
 

Recently uploaded (20)

Complementary feeding in infant IAP PROTOCOLS
Complementary feeding in infant IAP PROTOCOLSComplementary feeding in infant IAP PROTOCOLS
Complementary feeding in infant IAP PROTOCOLS
 
Promoting Wellbeing - Applied Social Psychology - Psychology SuperNotes
Promoting Wellbeing - Applied Social Psychology - Psychology SuperNotesPromoting Wellbeing - Applied Social Psychology - Psychology SuperNotes
Promoting Wellbeing - Applied Social Psychology - Psychology SuperNotes
 
Cell Therapy Expansion and Challenges in Autoimmune Disease
Cell Therapy Expansion and Challenges in Autoimmune DiseaseCell Therapy Expansion and Challenges in Autoimmune Disease
Cell Therapy Expansion and Challenges in Autoimmune Disease
 
Hemodialysis: Chapter 4, Dialysate Circuit - Dr.Gawad
Hemodialysis: Chapter 4, Dialysate Circuit - Dr.GawadHemodialysis: Chapter 4, Dialysate Circuit - Dr.Gawad
Hemodialysis: Chapter 4, Dialysate Circuit - Dr.Gawad
 
CHEMOTHERAPY_RDP_CHAPTER 2 _LEPROSY.pdf1
CHEMOTHERAPY_RDP_CHAPTER 2 _LEPROSY.pdf1CHEMOTHERAPY_RDP_CHAPTER 2 _LEPROSY.pdf1
CHEMOTHERAPY_RDP_CHAPTER 2 _LEPROSY.pdf1
 
Efficacy of Avartana Sneha in Ayurveda
Efficacy of Avartana Sneha in AyurvedaEfficacy of Avartana Sneha in Ayurveda
Efficacy of Avartana Sneha in Ayurveda
 
CHEMOTHERAPY_RDP_CHAPTER 6_Anti Malarial Drugs.pdf
CHEMOTHERAPY_RDP_CHAPTER 6_Anti Malarial Drugs.pdfCHEMOTHERAPY_RDP_CHAPTER 6_Anti Malarial Drugs.pdf
CHEMOTHERAPY_RDP_CHAPTER 6_Anti Malarial Drugs.pdf
 
Identifying Major Symptoms of Slip Disc.
 Identifying Major Symptoms of Slip Disc. Identifying Major Symptoms of Slip Disc.
Identifying Major Symptoms of Slip Disc.
 
Osteoporosis - Definition , Evaluation and Management .pdf
Osteoporosis - Definition , Evaluation and Management .pdfOsteoporosis - Definition , Evaluation and Management .pdf
Osteoporosis - Definition , Evaluation and Management .pdf
 
Does Over-Masturbation Contribute to Chronic Prostatitis.pptx
Does Over-Masturbation Contribute to Chronic Prostatitis.pptxDoes Over-Masturbation Contribute to Chronic Prostatitis.pptx
Does Over-Masturbation Contribute to Chronic Prostatitis.pptx
 
NARCOTICS- POLICY AND PROCEDURES FOR ITS USE
NARCOTICS- POLICY AND PROCEDURES FOR ITS USENARCOTICS- POLICY AND PROCEDURES FOR ITS USE
NARCOTICS- POLICY AND PROCEDURES FOR ITS USE
 
Medical Quiz ( Online Quiz for API Meet 2024 ).pdf
Medical Quiz ( Online Quiz for API Meet 2024 ).pdfMedical Quiz ( Online Quiz for API Meet 2024 ).pdf
Medical Quiz ( Online Quiz for API Meet 2024 ).pdf
 
K CỔ TỬ CUNG.pdf tự ghi chép, chữ hơi xấu
K CỔ TỬ CUNG.pdf tự ghi chép, chữ hơi xấuK CỔ TỬ CUNG.pdf tự ghi chép, chữ hơi xấu
K CỔ TỬ CUNG.pdf tự ghi chép, chữ hơi xấu
 
Journal Article Review on Rasamanikya
Journal Article Review on RasamanikyaJournal Article Review on Rasamanikya
Journal Article Review on Rasamanikya
 
Ear and its clinical correlations By Dr. Rabia Inam Gandapore.pptx
Ear and its clinical correlations By Dr. Rabia Inam Gandapore.pptxEar and its clinical correlations By Dr. Rabia Inam Gandapore.pptx
Ear and its clinical correlations By Dr. Rabia Inam Gandapore.pptx
 
The Electrocardiogram - Physiologic Principles
The Electrocardiogram - Physiologic PrinciplesThe Electrocardiogram - Physiologic Principles
The Electrocardiogram - Physiologic Principles
 
Hiranandani Hospital Powai News [Read Now].pdf
Hiranandani Hospital Powai News [Read Now].pdfHiranandani Hospital Powai News [Read Now].pdf
Hiranandani Hospital Powai News [Read Now].pdf
 
OCT Training Course for clinical practice Part 1
OCT Training Course for clinical practice Part 1OCT Training Course for clinical practice Part 1
OCT Training Course for clinical practice Part 1
 
CHEMOTHERAPY_RDP_CHAPTER 4_ANTI VIRAL DRUGS.pdf
CHEMOTHERAPY_RDP_CHAPTER 4_ANTI VIRAL DRUGS.pdfCHEMOTHERAPY_RDP_CHAPTER 4_ANTI VIRAL DRUGS.pdf
CHEMOTHERAPY_RDP_CHAPTER 4_ANTI VIRAL DRUGS.pdf
 
CHEMOTHERAPY_RDP_CHAPTER 3_ANTIFUNGAL AGENT.pdf
CHEMOTHERAPY_RDP_CHAPTER 3_ANTIFUNGAL AGENT.pdfCHEMOTHERAPY_RDP_CHAPTER 3_ANTIFUNGAL AGENT.pdf
CHEMOTHERAPY_RDP_CHAPTER 3_ANTIFUNGAL AGENT.pdf
 

2. Inferential statistics

  • 1. KNOWLEDGE FOR THE BENEFIT OF HUMANITYKNOWLEDGE FOR THE BENEFIT OF HUMANITY BIOSTATISTICS (HFS3283) INFERENTIAL STATISTICS Dr.Dr. MohdMohd RazifRazif ShahrilShahril School of Nutrition & DieteticsSchool of Nutrition & Dietetics Faculty of Health SciencesFaculty of Health Sciences UniversitiUniversiti SultanSultan ZainalZainal AbidinAbidin 1
  • 2. S C H O O L O F N U T R I T I O N A N D D I E T E T I C S • U N I V E R S I T I S U L T A N Z A I N A L A B I D I N Topic Learning Outcomes At the end of this lecture, students should be able to; • define inferential statistics. • explain hypothesis tests, p value and type I and II error • explain how to interpret confidence interval 2
  • 3. S C H O O L O F N U T R I T I O N A N D D I E T E T I C S • U N I V E R S I T I S U L T A N Z A I N A L A B I D I N 3
  • 4. S C H O O L O F N U T R I T I O N A N D D I E T E T I C S • U N I V E R S I T I S U L T A N Z A I N A L A B I D I N What is INFERENTIAL STATISTICS? 4 • It is the Statistical Technique/ method used to infer the result of the sample (statistic) to the population (parameter) PopulationPopulation SampleSample
  • 5. S C H O O L O F N U T R I T I O N A N D D I E T E T I C S • U N I V E R S I T I S U L T A N Z A I N A L A B I D I N Two types of inferential statistics 5 • Hypothesis tests – e.g. • Comparing 2 means • Comparing 2 proportions • Association between one variable and another variable • Estimation (Confidence interval) – e.g. • Estimating a mean (numerical) • Estimating a proportion (categorical) • 1 2
  • 6. S C H O O L O F N U T R I T I O N A N D D I E T E T I C S • U N I V E R S I T I S U L T A N Z A I N A L A B I D I N HypothesisHypothesis 6 • A statement derived from primary research question(s) • There may be more than one hypothesis to be tested in one study, but the fewer the better. • It usually comes out of a hunch, an educated guess based on published results or preliminary observations • In writing a hypothesis; – State hypothesis (hypotheses) clearly and specifically – Include study and outcome factors •
  • 7. S C H O O L O F N U T R I T I O N A N D D I E T E T I C S • U N I V E R S I T I S U L T A N Z A I N A L A B I D I N Research question?? 7 • A statement derived from primary research question(s) • Most studies are concerned with answering the following questions: – What is the magnitude of a health problem or health factor? – What is the causal relation between one factor (or factors) and the disease or outcome of interest? – What is the efficacy of an intervention? •
  • 8. S C H O O L O F N U T R I T I O N A N D D I E T E T I C S • U N I V E R S I T I S U L T A N Z A I N A L A B I D I N Hypothesis testing 8 • In Hypothesis testing, we answer to a specific question related to a population parameter (e.g. population mean nutrition knowledge score) using a sample statistic (e.g. sample mean nutrition knowledge score).
  • 9. S C H O O L O F N U T R I T I O N A N D D I E T E T I C S • U N I V E R S I T I S U L T A N Z A I N A L A B I D I N Hypothesis testing 9 • In Hypothesis testing, we answer to a specific question related to a population parameter (e.g. population mean BMI) using a sample statistic (e.g. sample mean BMI). • RQ – Is the BMI of the population different from 24.5 kg/m2 or not? • Answer – Yes or No – Null hypothesis (Ho ; µ = 24.5) – Alternate hypothesis (Ha ; µ ≠ 24.5)
  • 10. S C H O O L O F N U T R I T I O N A N D D I E T E T I C S • U N I V E R S I T I S U L T A N Z A I N A L A B I D I N Null hypothesis 10 • Is a mathematical statement of equality stated before data collection or data analysis • After statistical analysis, a p value is calculated. • Based on this p value, decision is made to either accept or reject the Ho.
  • 11. S C H O O L O F N U T R I T I O N A N D D I E T E T I C S • U N I V E R S I T I S U L T A N Z A I N A L A B I D I N Null hypothesis (cont.) 11
  • 12. S C H O O L O F N U T R I T I O N A N D D I E T E T I C S • U N I V E R S I T I S U L T A N Z A I N A L A B I D I N Hypothesis testing (cont.) 12 • RQ - Is the BMI of the population different from 24.5 kg/m2 or not? – Ho ; µ = 24.5 mean = 26.1, SD = 4.3 – Ha ; µ ≠ 24.5 n = 130 • This test is called “One sample t test”. • At the end of the hypothesis testing, we will get a P value. – If the P value is < 0.05, we reject the Null Hypothesis (Ho). And conclude as Ha. – If the P value is ≥ 0.05, we cannot reject the Null Hypothesis (Ho). And conclude as Ho.
  • 13. S C H O O L O F N U T R I T I O N A N D D I E T E T I C S • U N I V E R S I T I S U L T A N Z A I N A L A B I D I N Hypothesis testing (cont.) 13 • RQ - Is the BMI of the population different from 24.5 kg/m2 or not? – Ho ; µ = 24.5 mean = 26.1, SD = 4.3 – Ha ; µ ≠ 24.5 n = 130 • In above example, if we get P = 0.01, we reject the null hypothesis (Ho), then ... – We conclude as Alternative Hypothesis (Ha) … “the mean BMI of the population is different from 24.5 kg/m2”. – Alternatively, we may report as … “the mean BMI is significantly different from 24.5 kg/m2”. • Note: • (1) The second conclusion is more commonly used in the literature. • (2) These are “statistical conclusion”, not yet “research conclusion”.
  • 14. S C H O O L O F N U T R I T I O N A N D D I E T E T I C S • U N I V E R S I T I S U L T A N Z A I N A L A B I D I N Hypothesis testing (cont.) 14 • RQ - Is the BMI of the population different from 24.5 kg/m2 or not? – Ho ; µ = 24.5 mean = 26.1, SD = 4.3 – Ha ; µ ≠ 24.5 n = 130 • In above example, if we get P = 0.08, we CANNOT reject the null hypothesis, then … – We conclude as … “the mean BMI in the population is NOT different from 24.5 kg/m2”. – Alternatively we may report as ... “the mean BMI is NOT significantly different from 24.5 kg/m2”.
  • 15. S C H O O L O F N U T R I T I O N A N D D I E T E T I C S • U N I V E R S I T I S U L T A N Z A I N A L A B I D I N Hypothesis testing (cont.) 15 • RQ - Is the BMI of the population different from 24.5 kg/m2 or not? – Ho ; µ = 24.5 mean = 26.1, SD = 4.3 – Ha ; µ ≠ 24.5 n = 130 • In this one sample t test, there are assumptions or requirements that we need to fulfil/check. – (1) The sample is selected by using random sampling. – (2) Observations are independent. – (3) The data is “normally distributed” (called “Normality Assumption”).
  • 16. S C H O O L O F N U T R I T I O N A N D D I E T E T I C S • U N I V E R S I T I S U L T A N Z A I N A L A B I D I N Steps in Hypothesis Testing 16 Step (1):Step (1): Generate null and alternative hypothesis Step (2):Step (2): Set the significance level (α) Step (3):Step (3): Decide which statistical test to use and check the assumptions of the test Step (4):Step (4): Perform test statistic and associated p -value Step (5):Step (5): Make interpretation (based on p value & CI) Step (6):Step (6): Draw conclusion
  • 17. S C H O O L O F N U T R I T I O N A N D D I E T E T I C S • U N I V E R S I T I S U L T A N Z A I N A L A B I D I N P value? 17 • The p value is the probability (likehood) that the result or difference was due to chance. • A p value of 0.05 indicates that a 5% probability that the difference observed between the groups was due to chance
  • 18. S C H O O L O F N U T R I T I O N A N D D I E T E T I C S • U N I V E R S I T I S U L T A N Z A I N A L A B I D I N P value? (cont.) 18 • RQ - Is the BMI of the population different from 24.5 kg/m2 or not? – Ho ; µ = 24.5 mean = 26.1, SD = 4.3 – Ha ; µ ≠ 24.5 n = 130 • If the P value < 0.05, we reject the Null Hypothesis. • P value is the probability of error if you reject the Null Hypothesis and conclude as the Alternative Hypothesis. • Example: P value = 0.01. It means that … – There is 1% probability of error in our conclusion, if we conclude as Alternative Hypothesis (“significantly different”). – We normally, allow less than 5% error. That is why the cut-off point for P value is 0.05.
  • 19. S C H O O L O F N U T R I T I O N A N D D I E T E T I C S • U N I V E R S I T I S U L T A N Z A I N A L A B I D I N P value? (cont.) 19 • RQ - Is the BMI of the population different from 24.5 kg/m2 or not? – Ho ; µ = 24.5 mean = 26.1, SD = 4.3 – Ha ; µ ≠ 24.5 n = 130 • If the P value < 0.05, we reject the Null Hypothesis. • P value is the probability of error if you reject the Null Hypothesis and conclude as the Alternative Hypothesis. • Example: P value = 0.2. It means that … – There is 20% probability of error in our conclusion, if we conclude as Alternative Hypothesis (“significantly different”). – Therefore, we can’t conclude as it is “significantly different”. We have to conclude as “the difference is not significant”.
  • 20. S C H O O L O F N U T R I T I O N A N D D I E T E T I C S • U N I V E R S I T I S U L T A N Z A I N A L A B I D I N P value? (cont.) 20 • RQ - Is the BMI of the population different from 24.5 kg/m2 or not? – Ho ; µ = 24.5 mean = 26.1, SD = 4.3 – Ha ; µ ≠ 24.5 n = 130 • If the P value < 0.05, we reject the Null Hypothesis. • It means that we have set the cut-off point at P less than 0.05 to reject the Ho. • We say this as setting the “Alpha” at 0.05 • Because the type of error that we have been talking about, is called “Type I error” or “Alpha error”.
  • 21. S C H O O L O F N U T R I T I O N A N D D I E T E T I C S • U N I V E R S I T I S U L T A N Z A I N A L A B I D I N One-sided or Two-sided test? 21 • RQa - Is the BMI of the population different from 24.5 kg/m2 or not? – Ho ; µ = 24.5 – Ha ; µ ≠ 24.5 • RQb - Is the BMI of the population more than 24.5 kgm2 or not? – Ho ; µ ≤ 24.5 – Ha ; µ > 24.5 • RQc - Is the BMI of the population less than 24.5 kgm2 or not? – Ho ; µ ≥ 24.5 – Ha ; µ < 24.5 TwoTwo--sided hypothesis testsided hypothesis test OneOne--sided hypothesis testsided hypothesis test OneOne--sided hypothesis testsided hypothesis test
  • 22. S C H O O L O F N U T R I T I O N A N D D I E T E T I C S • U N I V E R S I T I S U L T A N Z A I N A L A B I D I N One-sided or Two-sided test? (cont.) 22
  • 23. S C H O O L O F N U T R I T I O N A N D D I E T E T I C S • U N I V E R S I T I S U L T A N Z A I N A L A B I D I N Type I (α) and Type II (ɞ) Error 23 Usually we set; • Type I (α) error = 5% • Type II (ɞ) error = 20%
  • 24. S C H O O L O F N U T R I T I O N A N D D I E T E T I C S • U N I V E R S I T I S U L T A N Z A I N A L A B I D I N Type I (α) and Type II (ɞ) Error (cont.) 24 Power = 1 - ɞ Usually, power = 1 – 0.2 = 0.8 or 80%
  • 25. S C H O O L O F N U T R I T I O N A N D D I E T E T I C S • U N I V E R S I T I S U L T A N Z A I N A L A B I D I N Type I (α) and Type II (ɞ) Error (cont.) 25
  • 26. S C H O O L O F N U T R I T I O N A N D D I E T E T I C S • U N I V E R S I T I S U L T A N Z A I N A L A B I D I N Estimation (Confidence Interval)Estimation (Confidence Interval) 26 • Used to express degree of confidence in an estimate • Denotes the range of possible values the estimate may assume, with a certain degree of assurance • Gives reliability on an estimate. • E.g. – If mean systolic BP level is 118 mmHg and 95% CI is (110, 125); it means that you can be 95% confident that the true systolic BP level mean lies between 110mmHg and 125mmHg.
  • 27. S C H O O L O F N U T R I T I O N A N D D I E T E T I C S • U N I V E R S I T I S U L T A N Z A I N A L A B I D I N Estimation a Mean 27 • Formula = mean ± (t α/2 x SE) • Calculation example; – The systolic BP of 100 students in a class Mean = 123.4 mmHg SD = 14.0 mmHg – The 95% CI = Mean ± t α/2 x (SD/√n) = 123.4 ± (1.98 x 14/10) – The 95% CI ranges from 120.6 mmHg to 126.2 mmHg – We can be 95% sure that this range includes the true population mean. •
  • 28. S C H O O L O F N U T R I T I O N A N D D I E T E T I C S • U N I V E R S I T I S U L T A N Z A I N A L A B I D I N Assumption or Requirement 28 Calculation can be made only ... 1) When the sample is selected by using random sampling 2) When the observations are independent 3) When the data is “normally distributed” (called “Normality Assumption”)
  • 29. S C H O O L O F N U T R I T I O N A N D D I E T E T I C S • U N I V E R S I T I S U L T A N Z A I N A L A B I D I N Estimation a Proportion 29 • Formula = p ± (Z α/2 x SE) • Calculation example; – The abnormal systolic BP of 100 students in a class Prevalence = 37% – The 95% CI = p ± (Z α/2 x SE) = 0.37 ± (1.96 x √((0.37*0.63)/100) – The 95% CI ranges from 0.27 to 0.47 (or 27% to 47%) – We can be 95% sure that this range includes the true population proportion. •
  • 30. S C H O O L O F N U T R I T I O N A N D D I E T E T I C S • U N I V E R S I T I S U L T A N Z A I N A L A B I D I N Assumption or Requirement 30 Calculation can be made only ... 1) When the sample is selected by using random sampling 2) When the observations are independent 3) BOTH (n*p) and (n *(1-p)) must be more than 5 count. Note: • Recode into 0 and 1; – 1 should be ‘disease’ or condition of interest. – 0 should be ‘non-disease’ or the rest.
  • 31. S C H O O L O F N U T R I T I O N A N D D I E T E T I C S • U N I V E R S I T I S U L T A N Z A I N A L A B I D I N P value and Confidence Interval 31 • When using statistics to compare 2 groups, 2 approaches can be used; – Calculation of p value – Calculation of confidence interval • Both p values and confidence interval are complimentary and should be used together.
  • 32. S C H O O L O F N U T R I T I O N A N D D I E T E T I C S • U N I V E R S I T I S U L T A N Z A I N A L A B I D I N Limitation of P value 32 • p values are sensitive to sample size – Large sample size, smaller p value • p values are sensitive to the magnitude of difference between the two group: – If the difference is small but samples are large, results can still be statistically significant – If the difference is large but samples are small, result would not be statistically significant