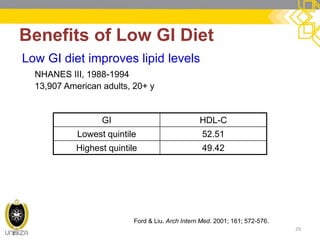
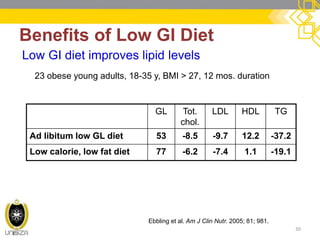
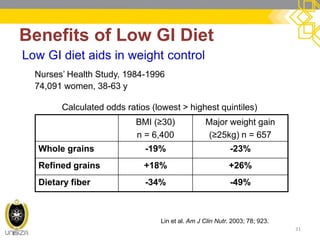
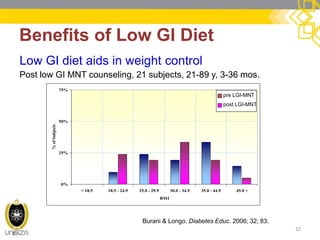
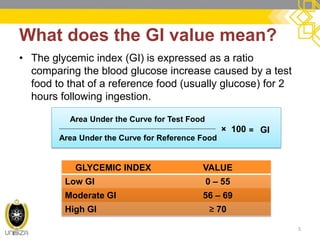
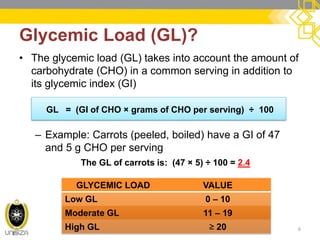
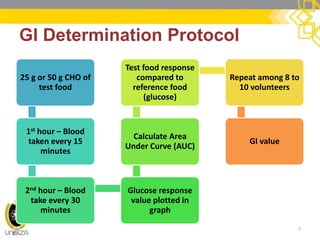
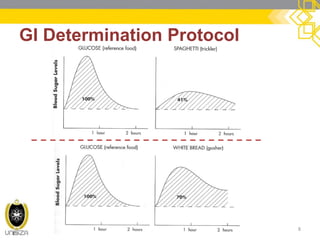
This document discusses glycemic index (GI), a measure of how foods affect blood glucose levels. It provides details on GI determination, factors that influence GI values, benefits of a low GI diet, and recommendations. Specifically, it finds that a low GI diet is associated with lower blood glucose and HbA1c levels, improved lipid profiles, weight control, and decreased risk of heart disease and diabetes. The take home message encourages choosing high-fiber whole grains and fruits/veggies while limiting refined sugars and large portions of high GI foods.

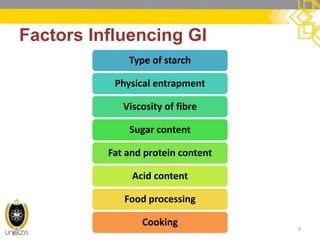
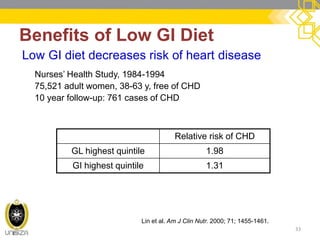
![[1] Type of starch
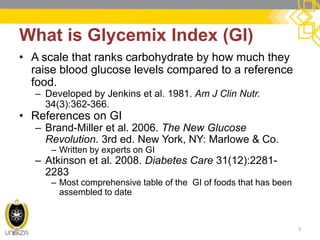
10
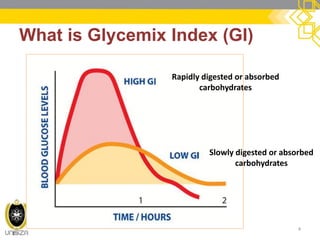
Amylose
Absorbs less water
Molecules form tight clumps
Slower rate of digestion
LOWER GI
E.g. Kidney beans (28)
Amylopectin
Absorbs more water
Molecules are more open
Faster rate of digestion
HIGHER GI
Eg. Russet potato (85)](https://image.slidesharecdn.com/6-141214222036-conversion-gate01/85/6-Glycemic-index-10-320.jpg)
![[1] Type of starch
11](https://image.slidesharecdn.com/6-141214222036-conversion-gate01/85/6-Glycemic-index-11-320.jpg)
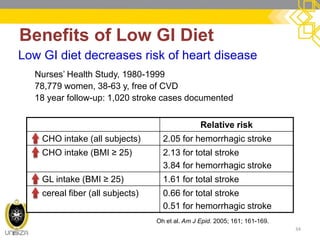
![[2] Physical entrapment
•Bran acts as a physical barrier that slows down enzymatic activity on the internal starch layer.
•Lower GI
–All Bran (38)
–Pumpernickel bread (50)
•Higher GI
–Bagel (72)
–Corn Flakes (92)
12](https://image.slidesharecdn.com/6-141214222036-conversion-gate01/85/6-Glycemic-index-12-320.jpg)
![[2] Physical entrapment
13](https://image.slidesharecdn.com/6-141214222036-conversion-gate01/85/6-Glycemic-index-13-320.jpg)
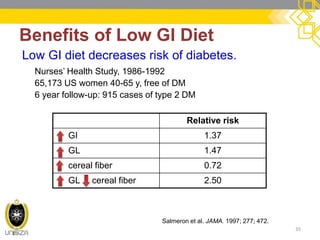
![[3] Viscosity of fibre
•Viscous, soluble fibers transform intestinal contents into gel-like matter that slows down enzymatic activity on starch.
•High soluble fibre = lower GI
•Lower GI
–Apple (40)
–Rolled oats (51)
•Higher GI
–Whole wheat bread (73)
–Cheerios (74)
14](https://image.slidesharecdn.com/6-141214222036-conversion-gate01/85/6-Glycemic-index-14-320.jpg)
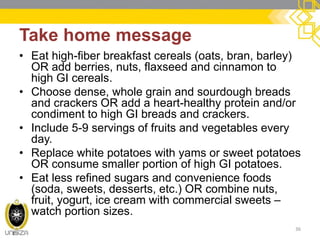
![[4] Sugar content
15](https://image.slidesharecdn.com/6-141214222036-conversion-gate01/85/6-Glycemic-index-15-320.jpg)
![[4] Sugar content
•Lower GI
–Frosted Flakes (55)
–Raisin Bran (61)
•Higher GI
–Golden Grahams (71)
–Rice Krispies (82)
16
sugar sucrose glucose + fructose
starch maltose glucose + glucose
(GI 60) (GI 100) (GI 19)
(GI 105) (GI 100) (GI 100)](https://image.slidesharecdn.com/6-141214222036-conversion-gate01/85/6-Glycemic-index-16-320.jpg)
![[5] Fat and protein content
•Fat and protein slow down gastric emptying, and thus, slows down digestion of starch.
•High fat and protein foods have lower GI
•Lower GI
–Peanut M&M’s (33)
–Potato chips (54)
–Special K (69)
•Higher GI
–Jelly beans (78)
–Baked potato (85)
–Corn Flakes (92)
17](https://image.slidesharecdn.com/6-141214222036-conversion-gate01/85/6-Glycemic-index-17-320.jpg)
![[6] Acid content
•Acid slows down gastric emptying, and thus, slows down the digestion of starch.
•Foods with higher acid content = lower GI
•Lower GI
–Sourdough wheat bread (54)
•Higher GI
–Wonder white bread (73)
18](https://image.slidesharecdn.com/6-141214222036-conversion-gate01/85/6-Glycemic-index-18-320.jpg)
![[7] Food processing
•Highly processed foods require less digestive processing.
•Processed foods = higher GI
•Lower GI
–Old fashioned, rolled oats (51)
•Higher GI
–Quick, 1-minute oats (66)
19](https://image.slidesharecdn.com/6-141214222036-conversion-gate01/85/6-Glycemic-index-19-320.jpg)
![[8] Cooking
•Cooking swells starch molecules and softens foods, which speeds up the rate of digestion.
•Overly cooked foods = Higher GI
•Lower GI
–Al dente spaghetti – boiled 10 to 15 minutes (44)
•Higher GI
–Over-cooked spaghetti – boiled 20 minutes (64)
20](https://image.slidesharecdn.com/6-141214222036-conversion-gate01/85/6-Glycemic-index-20-320.jpg)