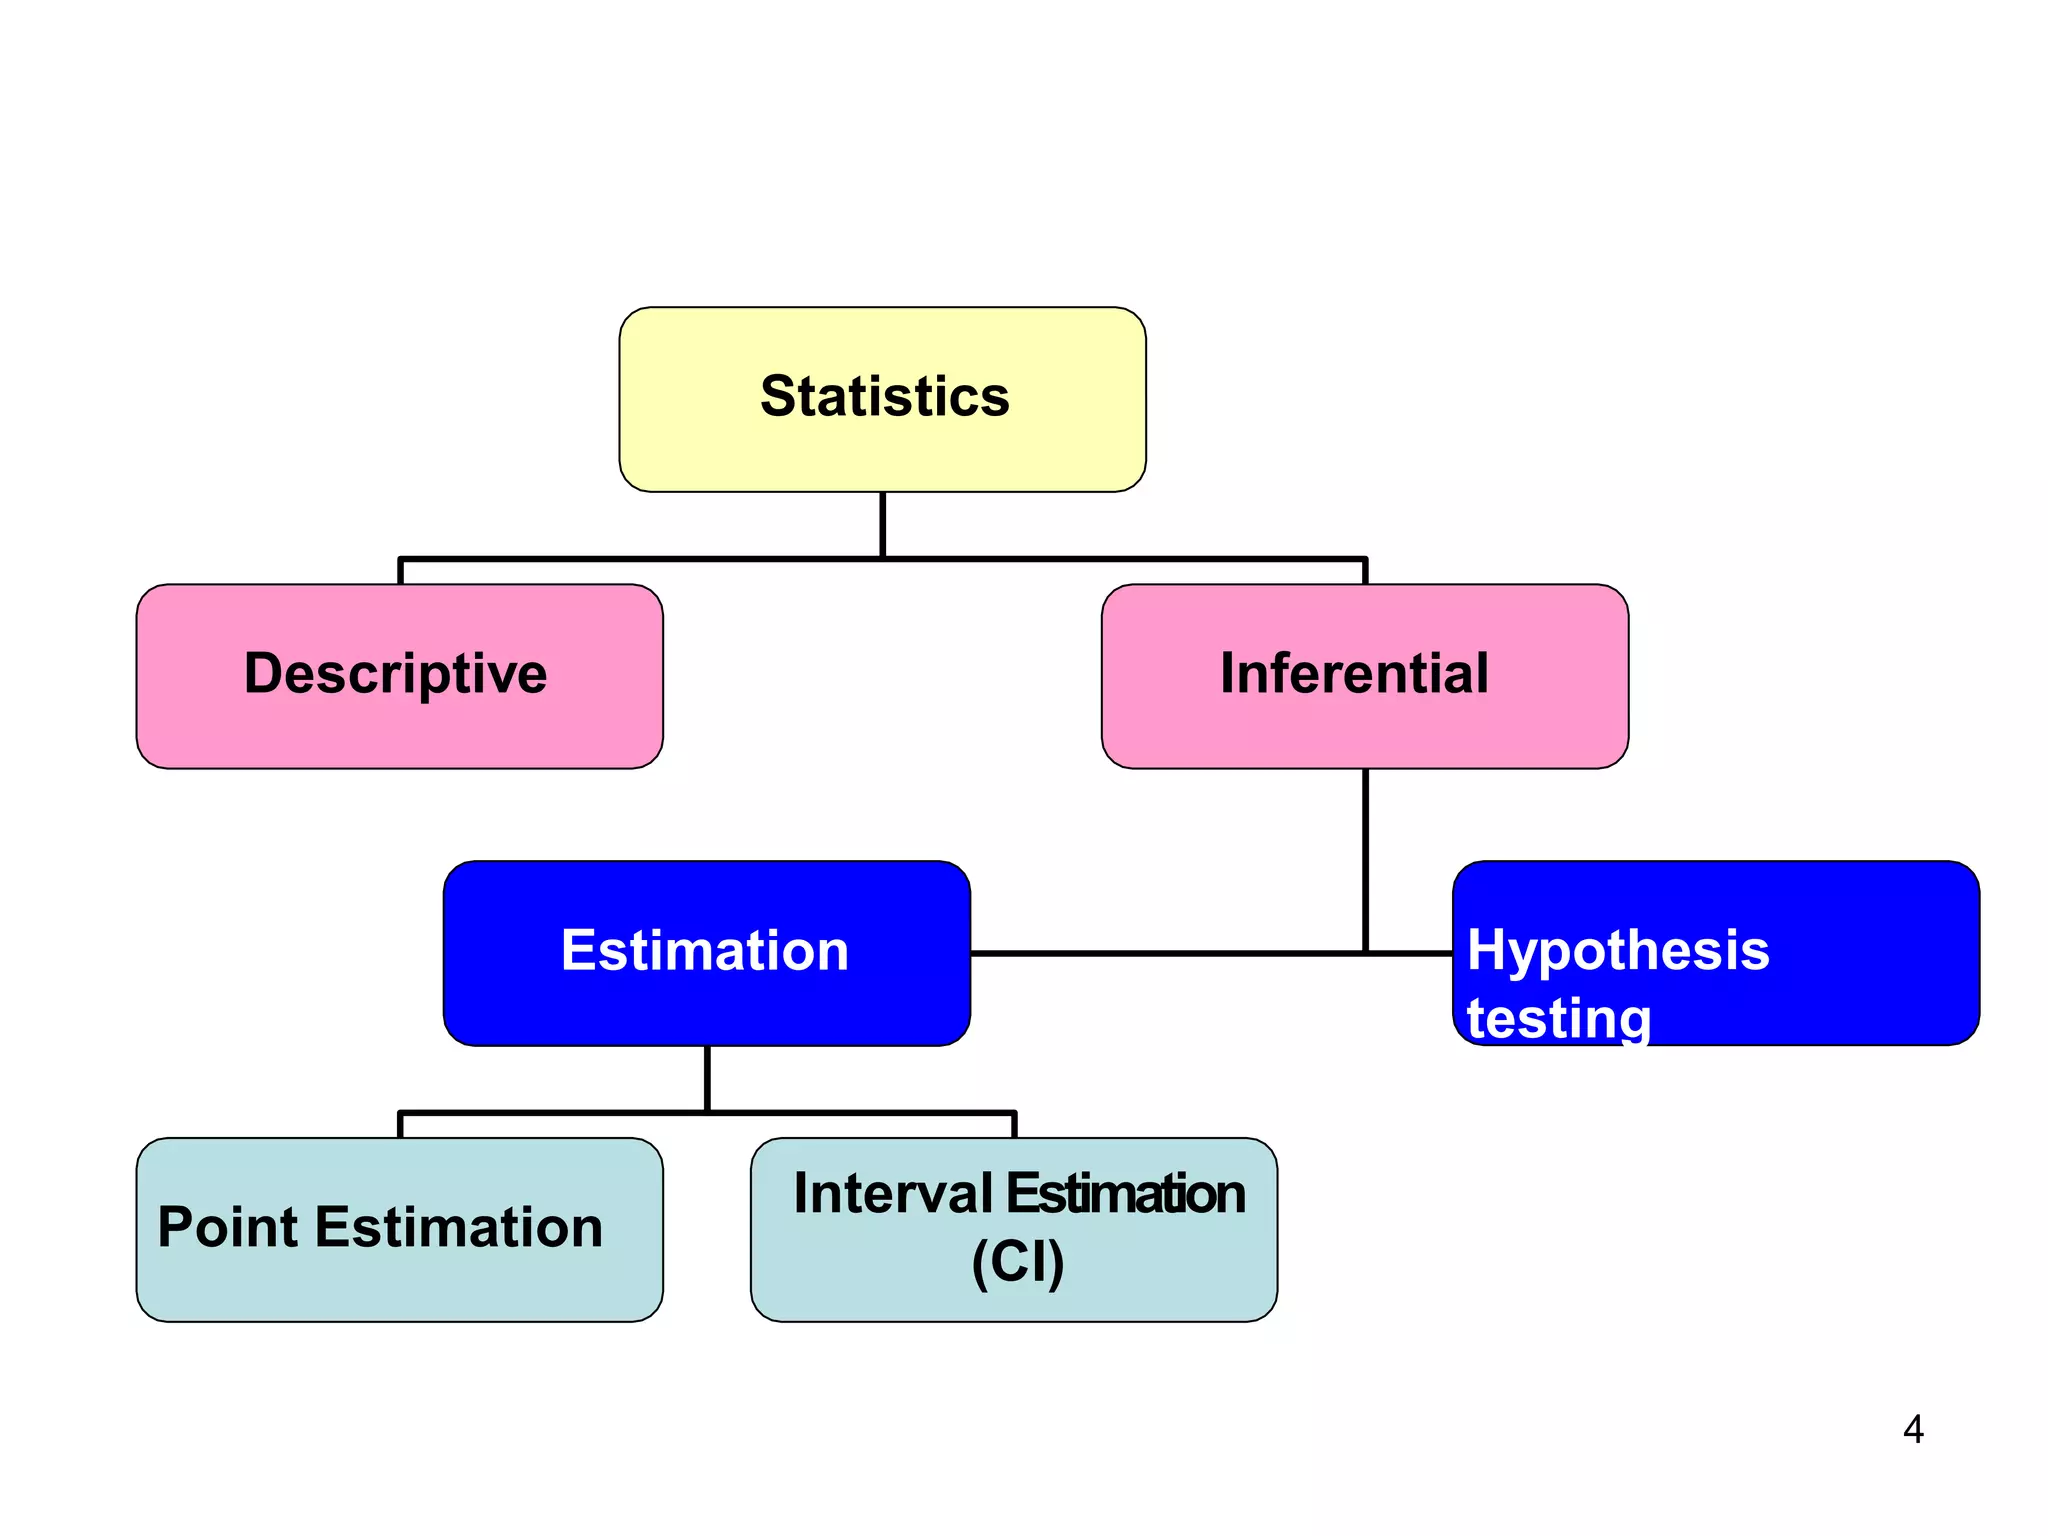
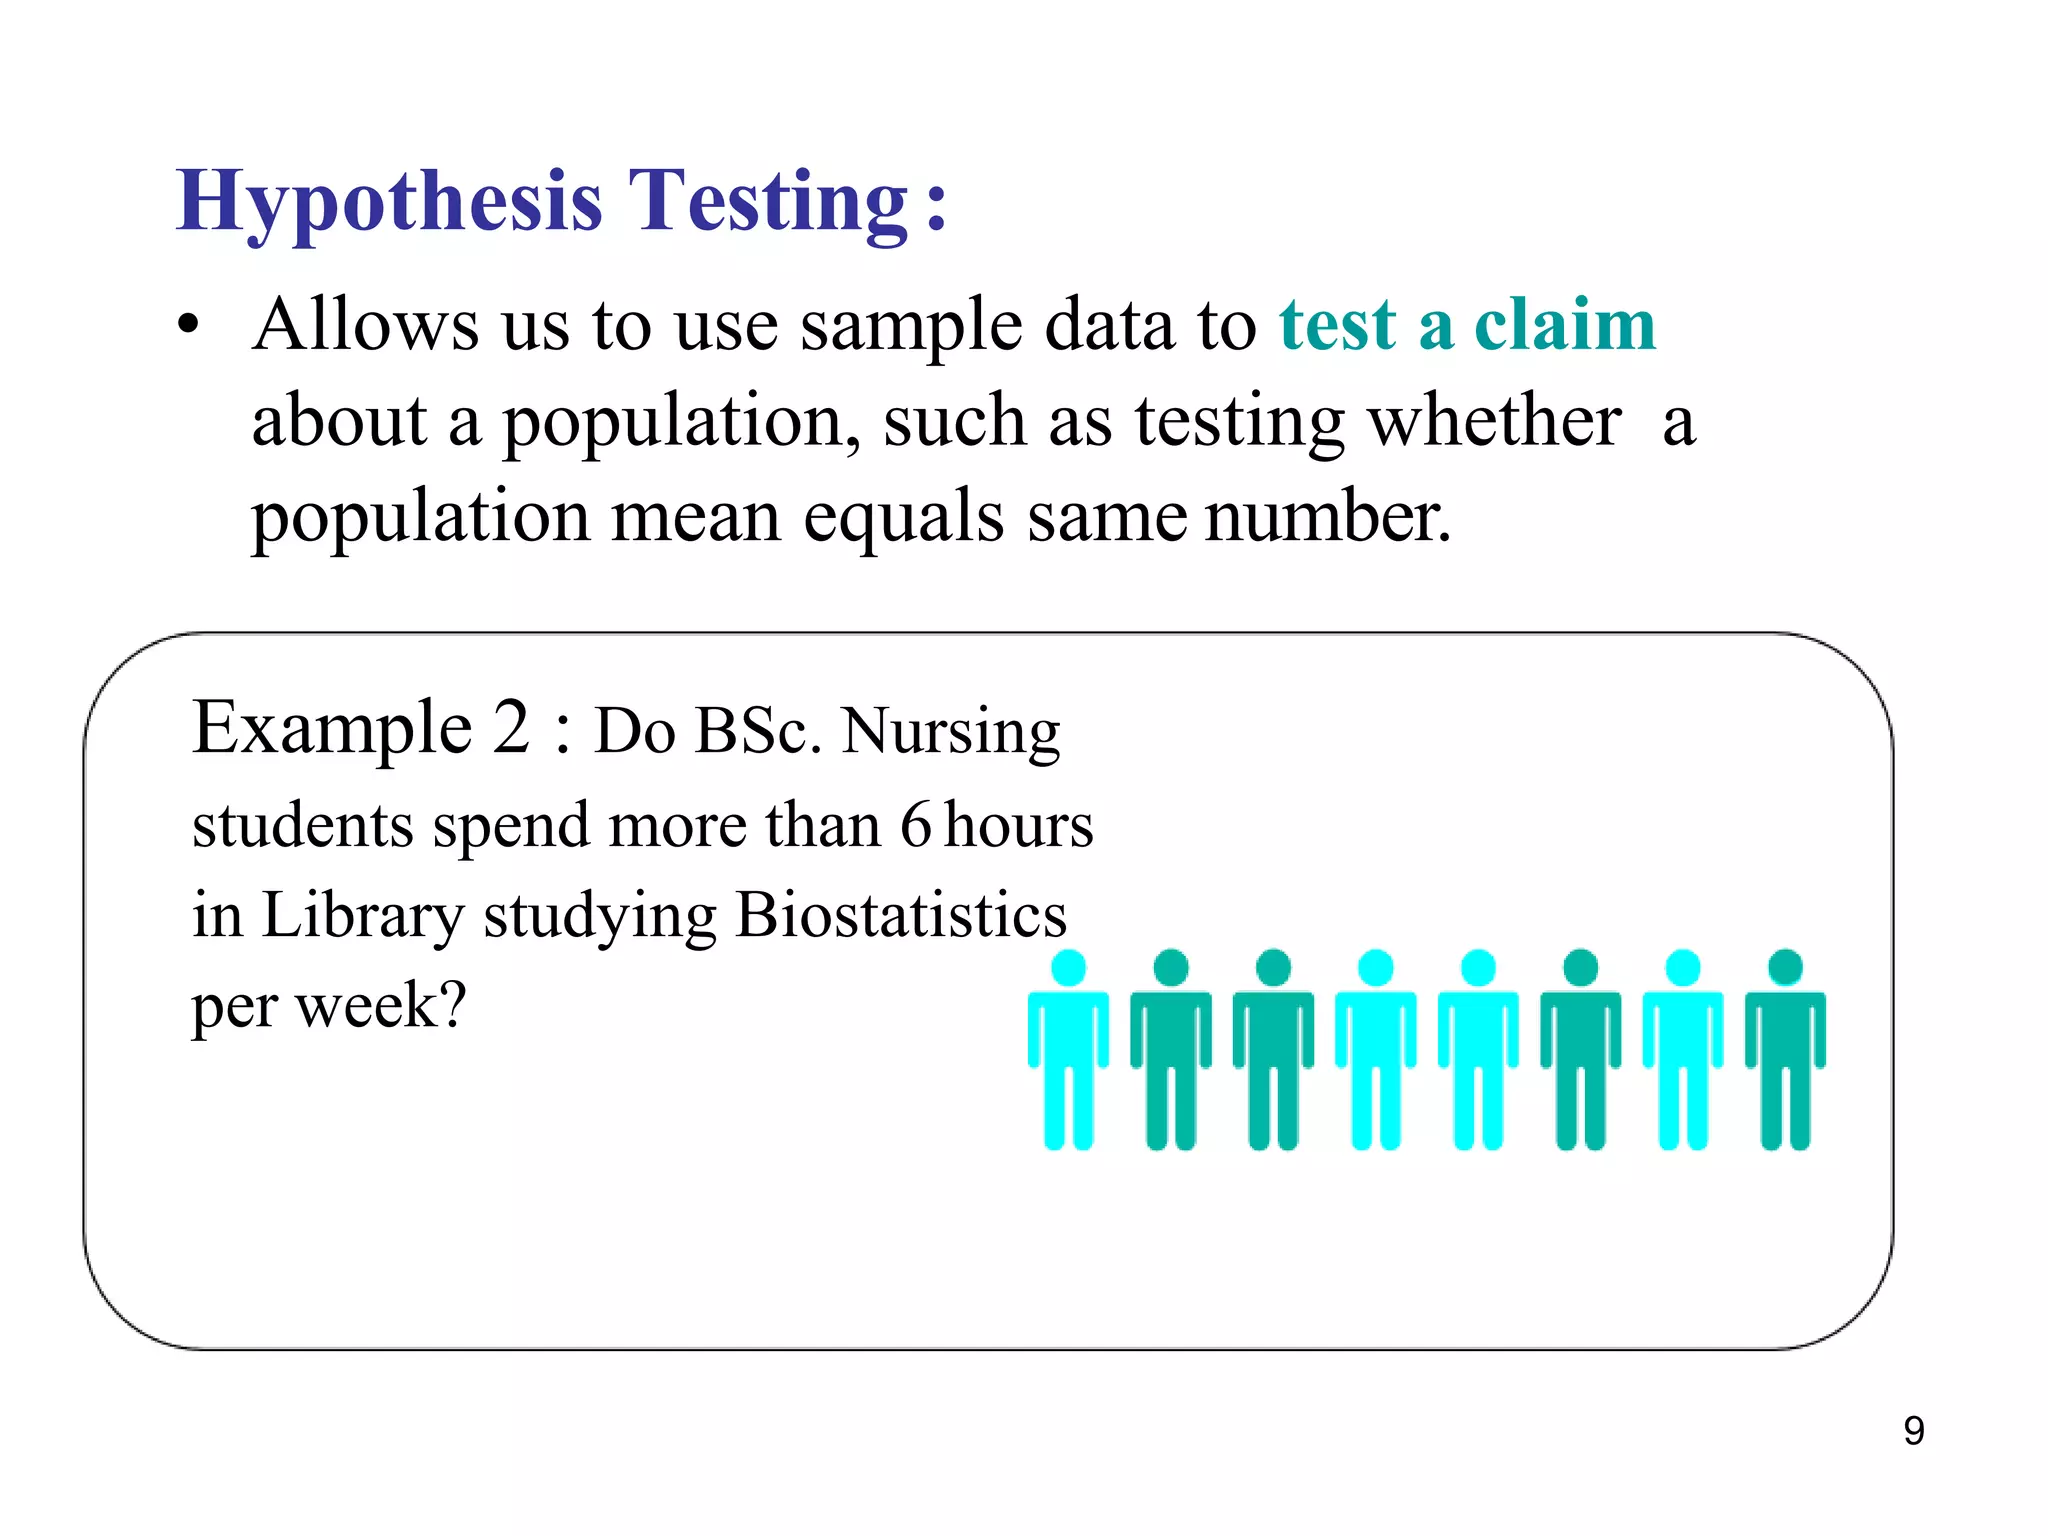
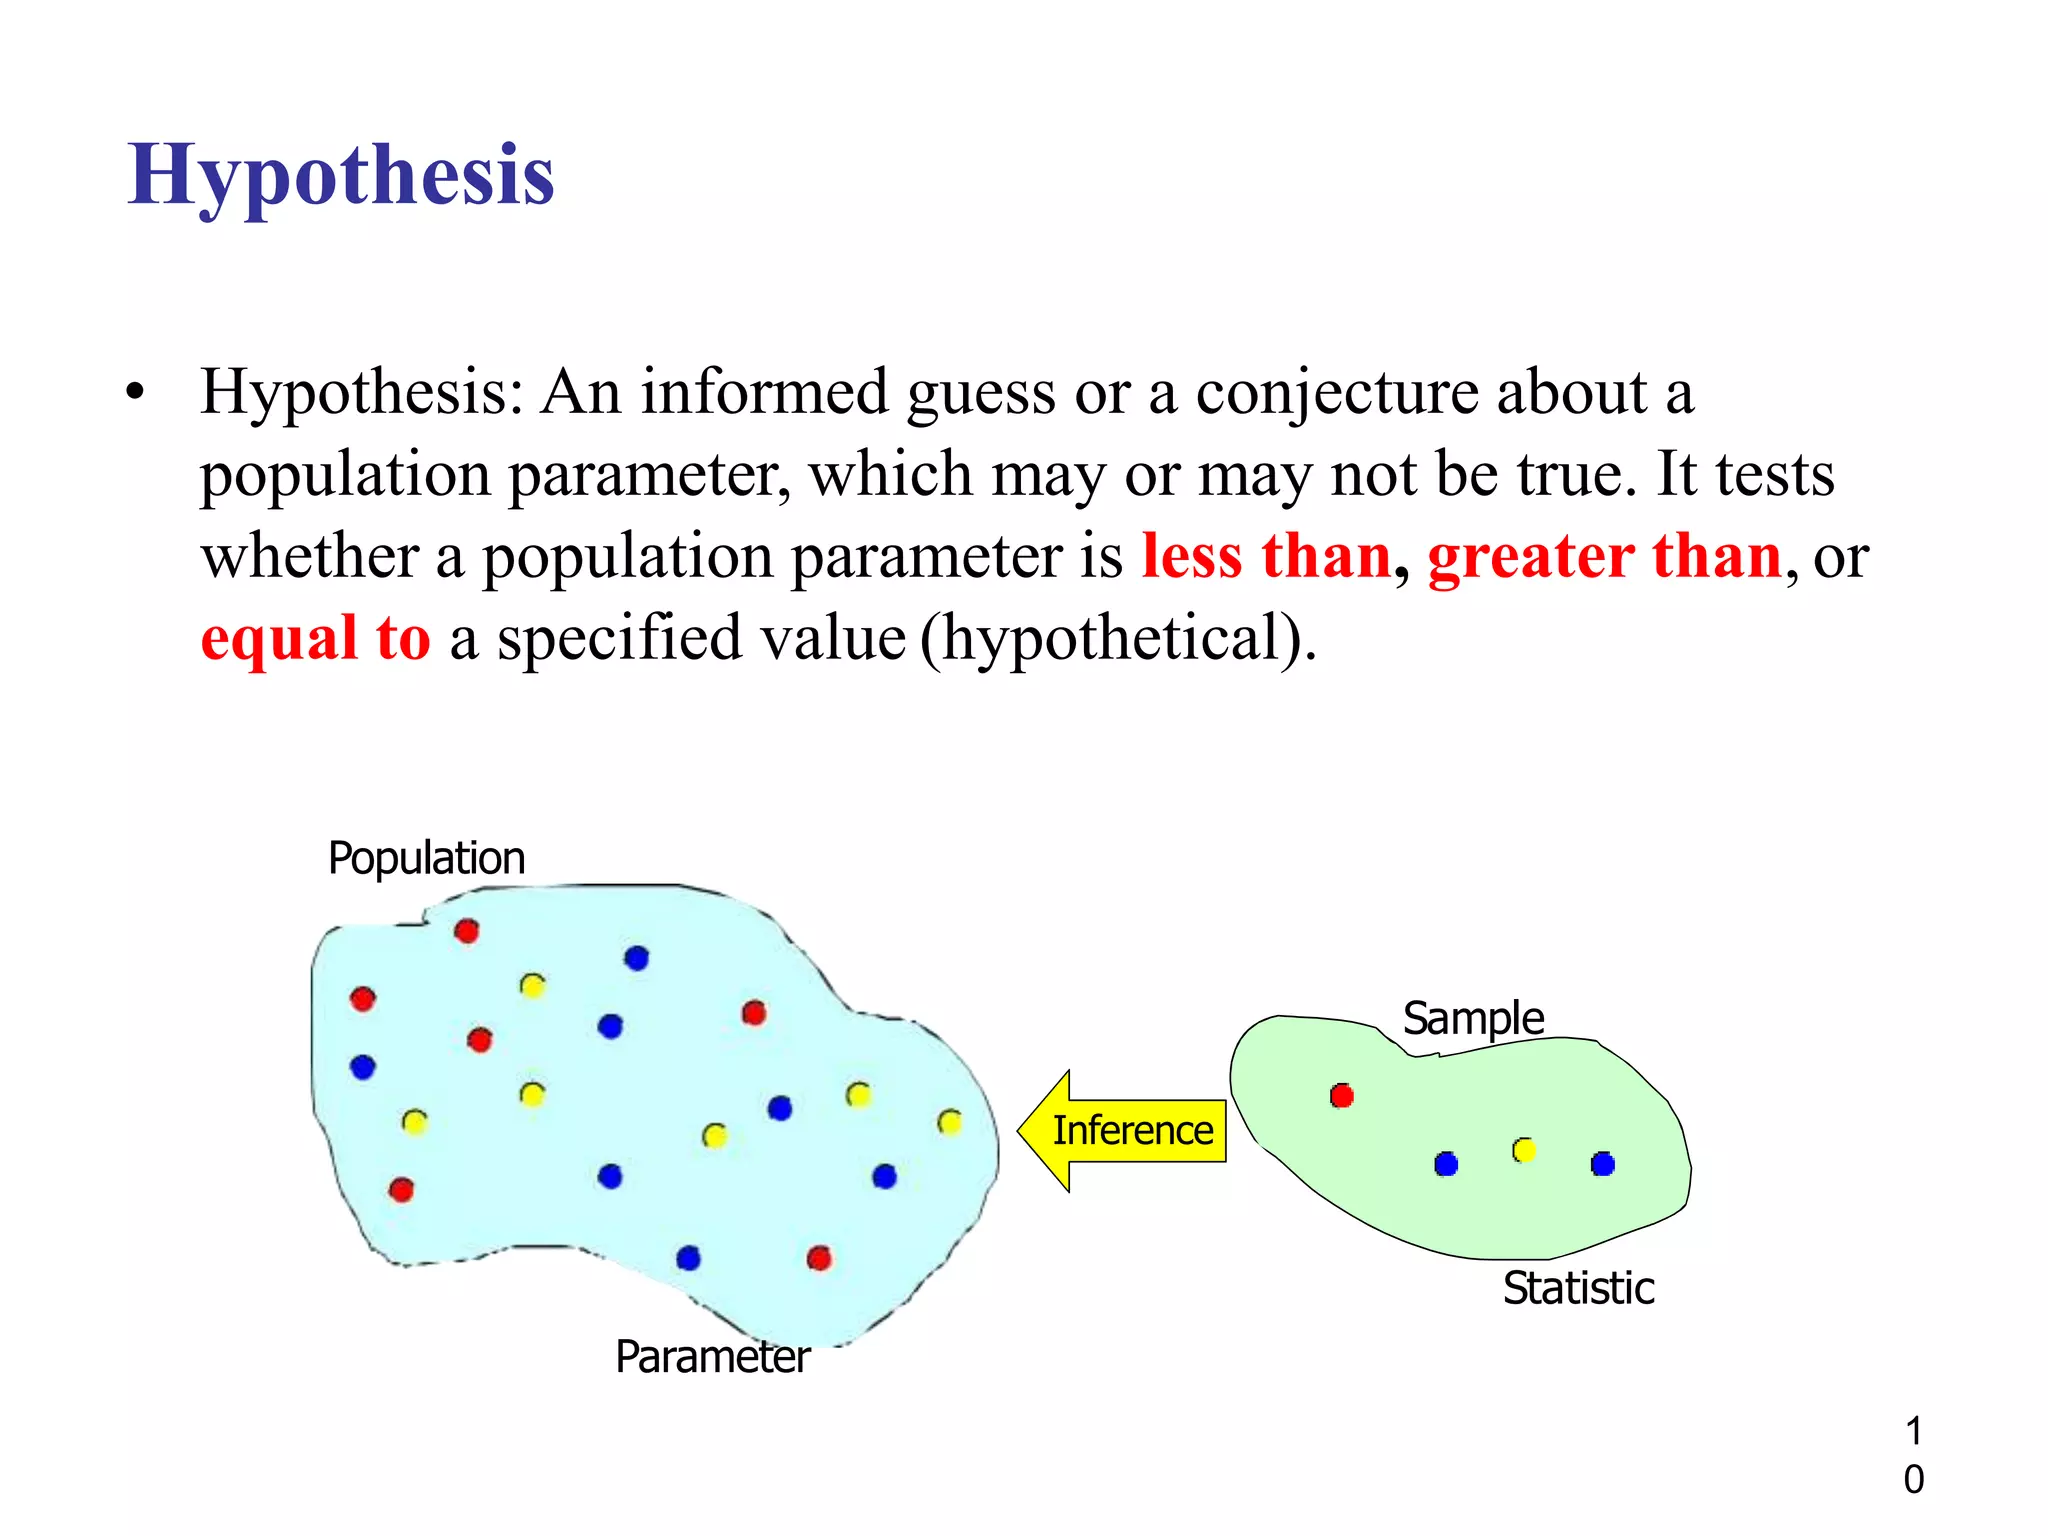
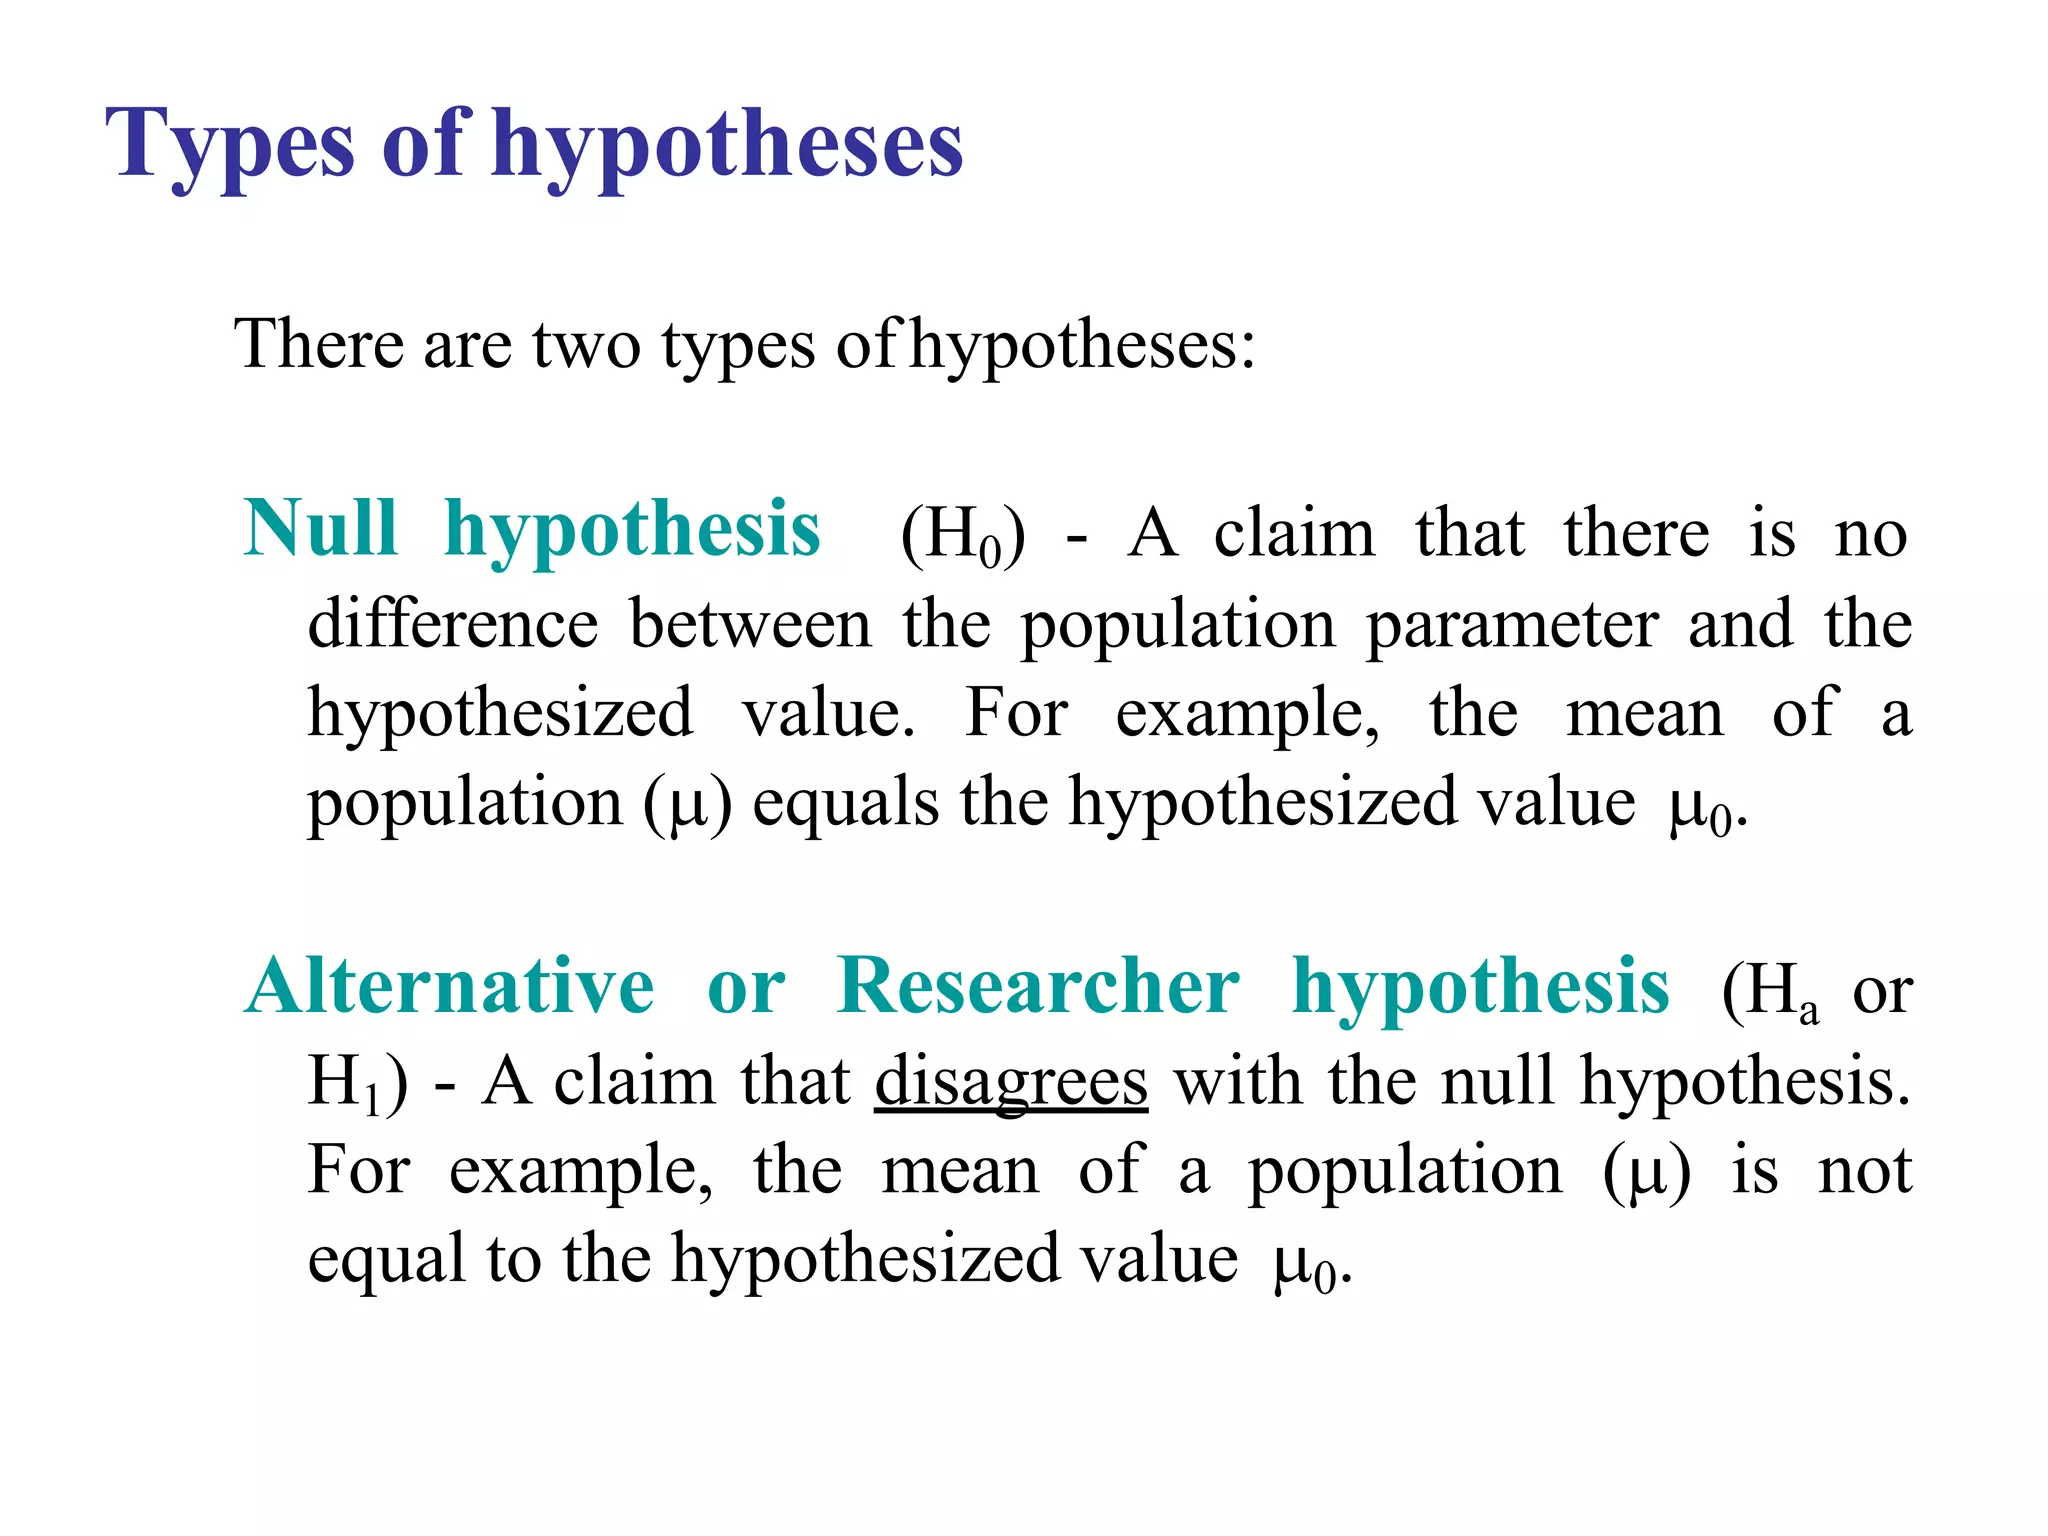
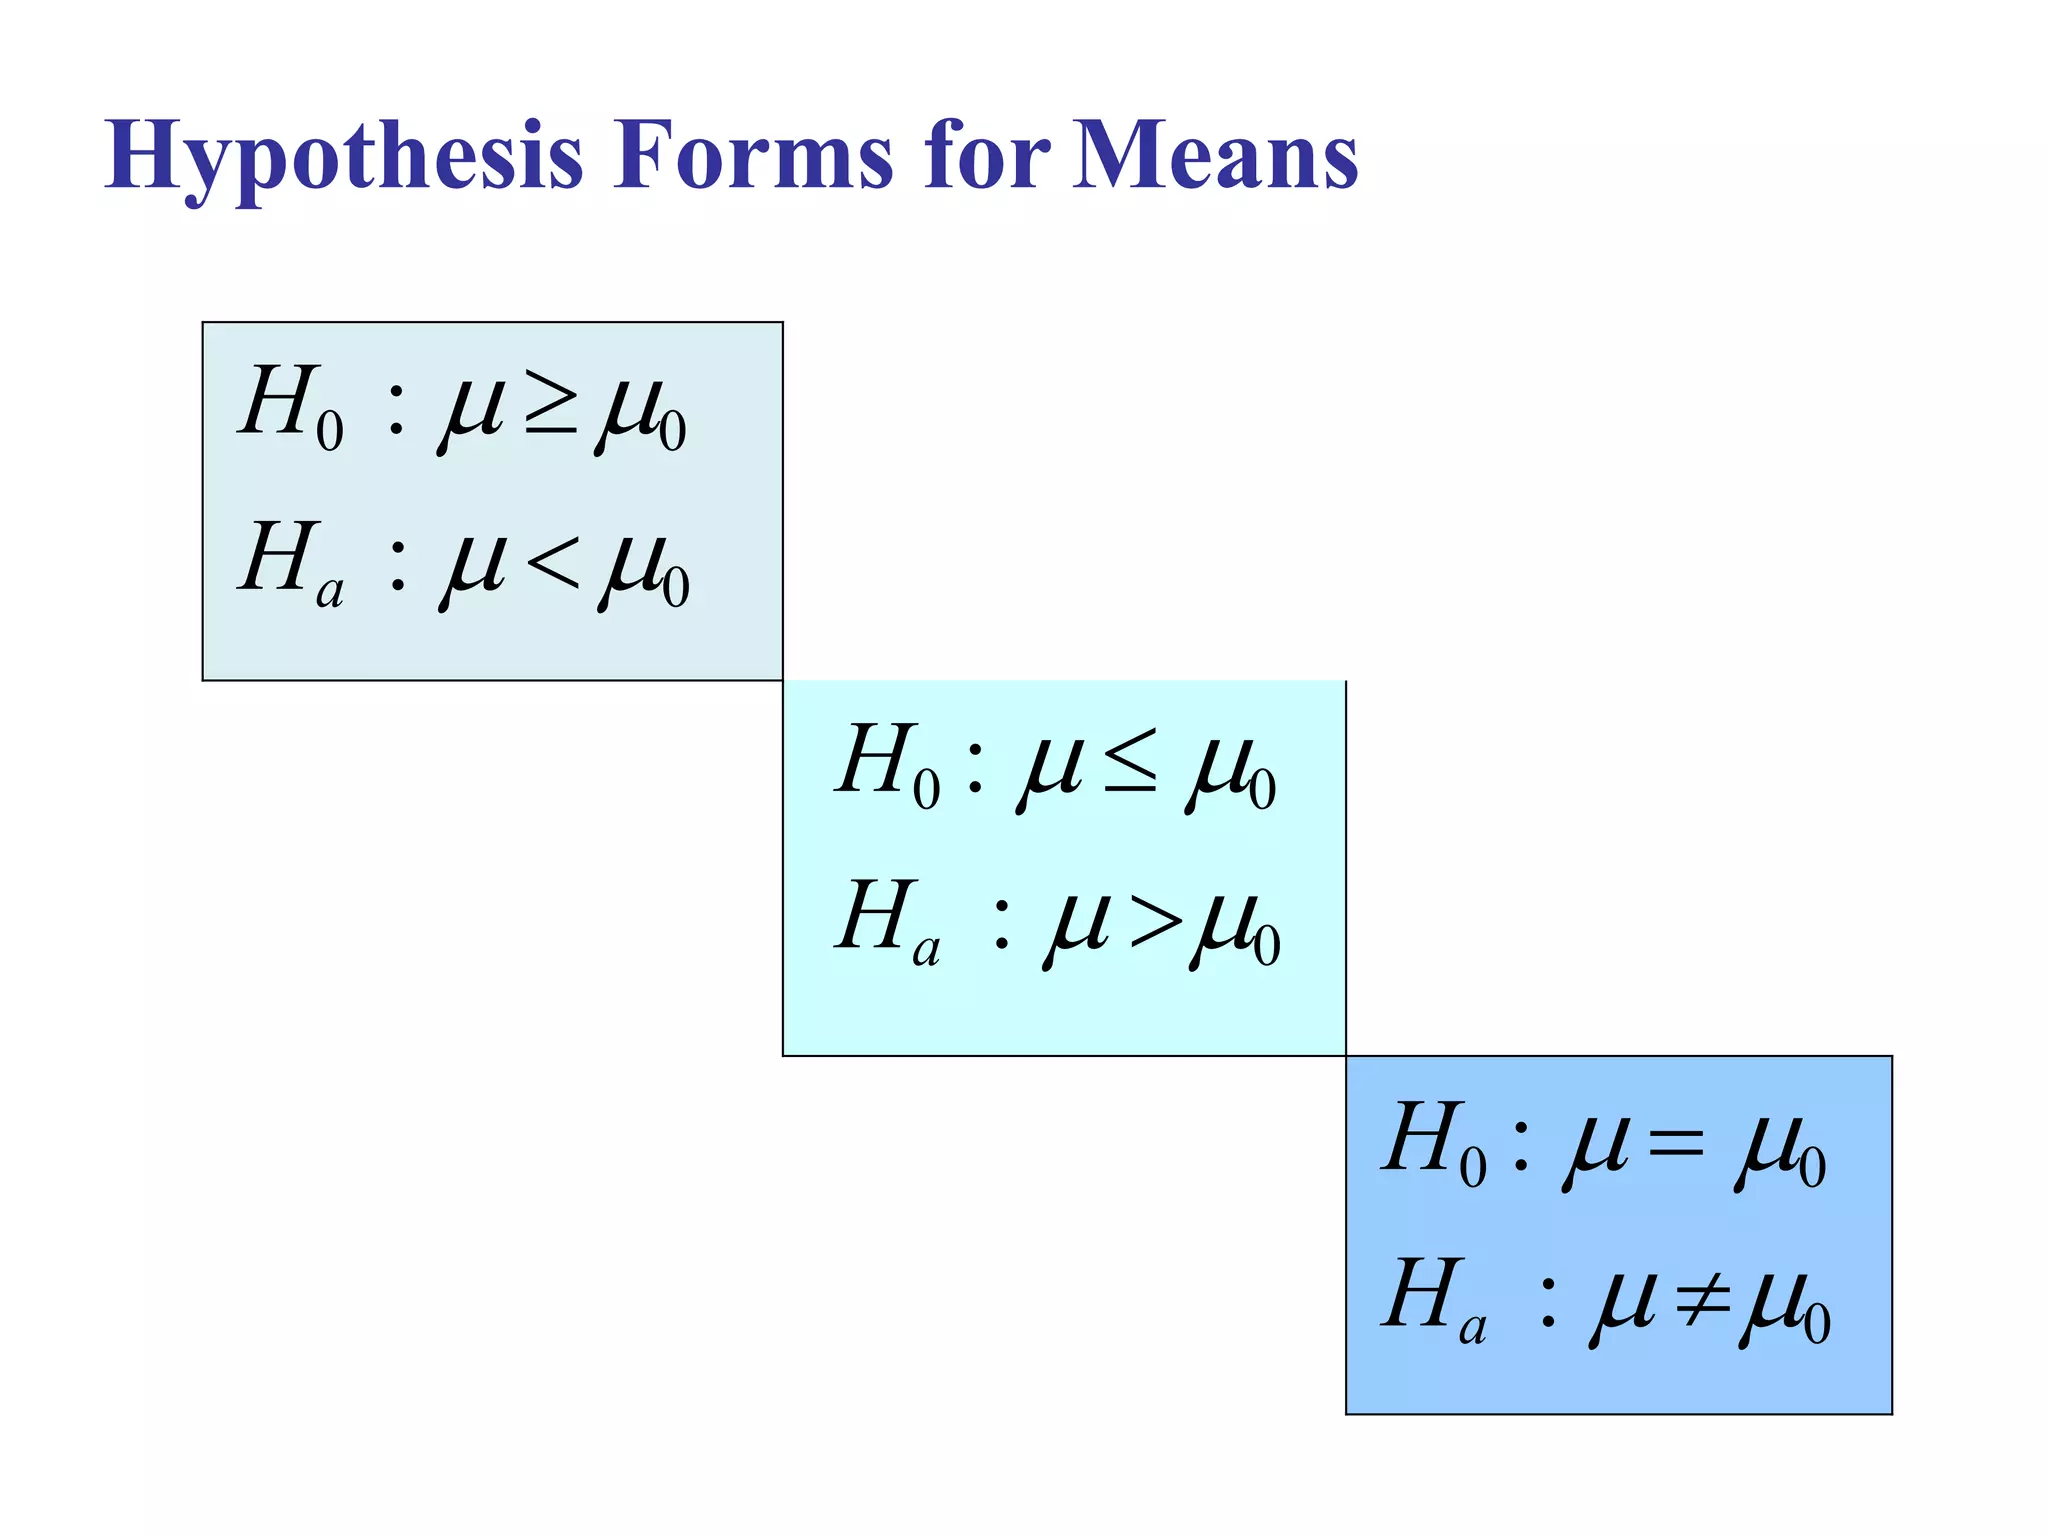
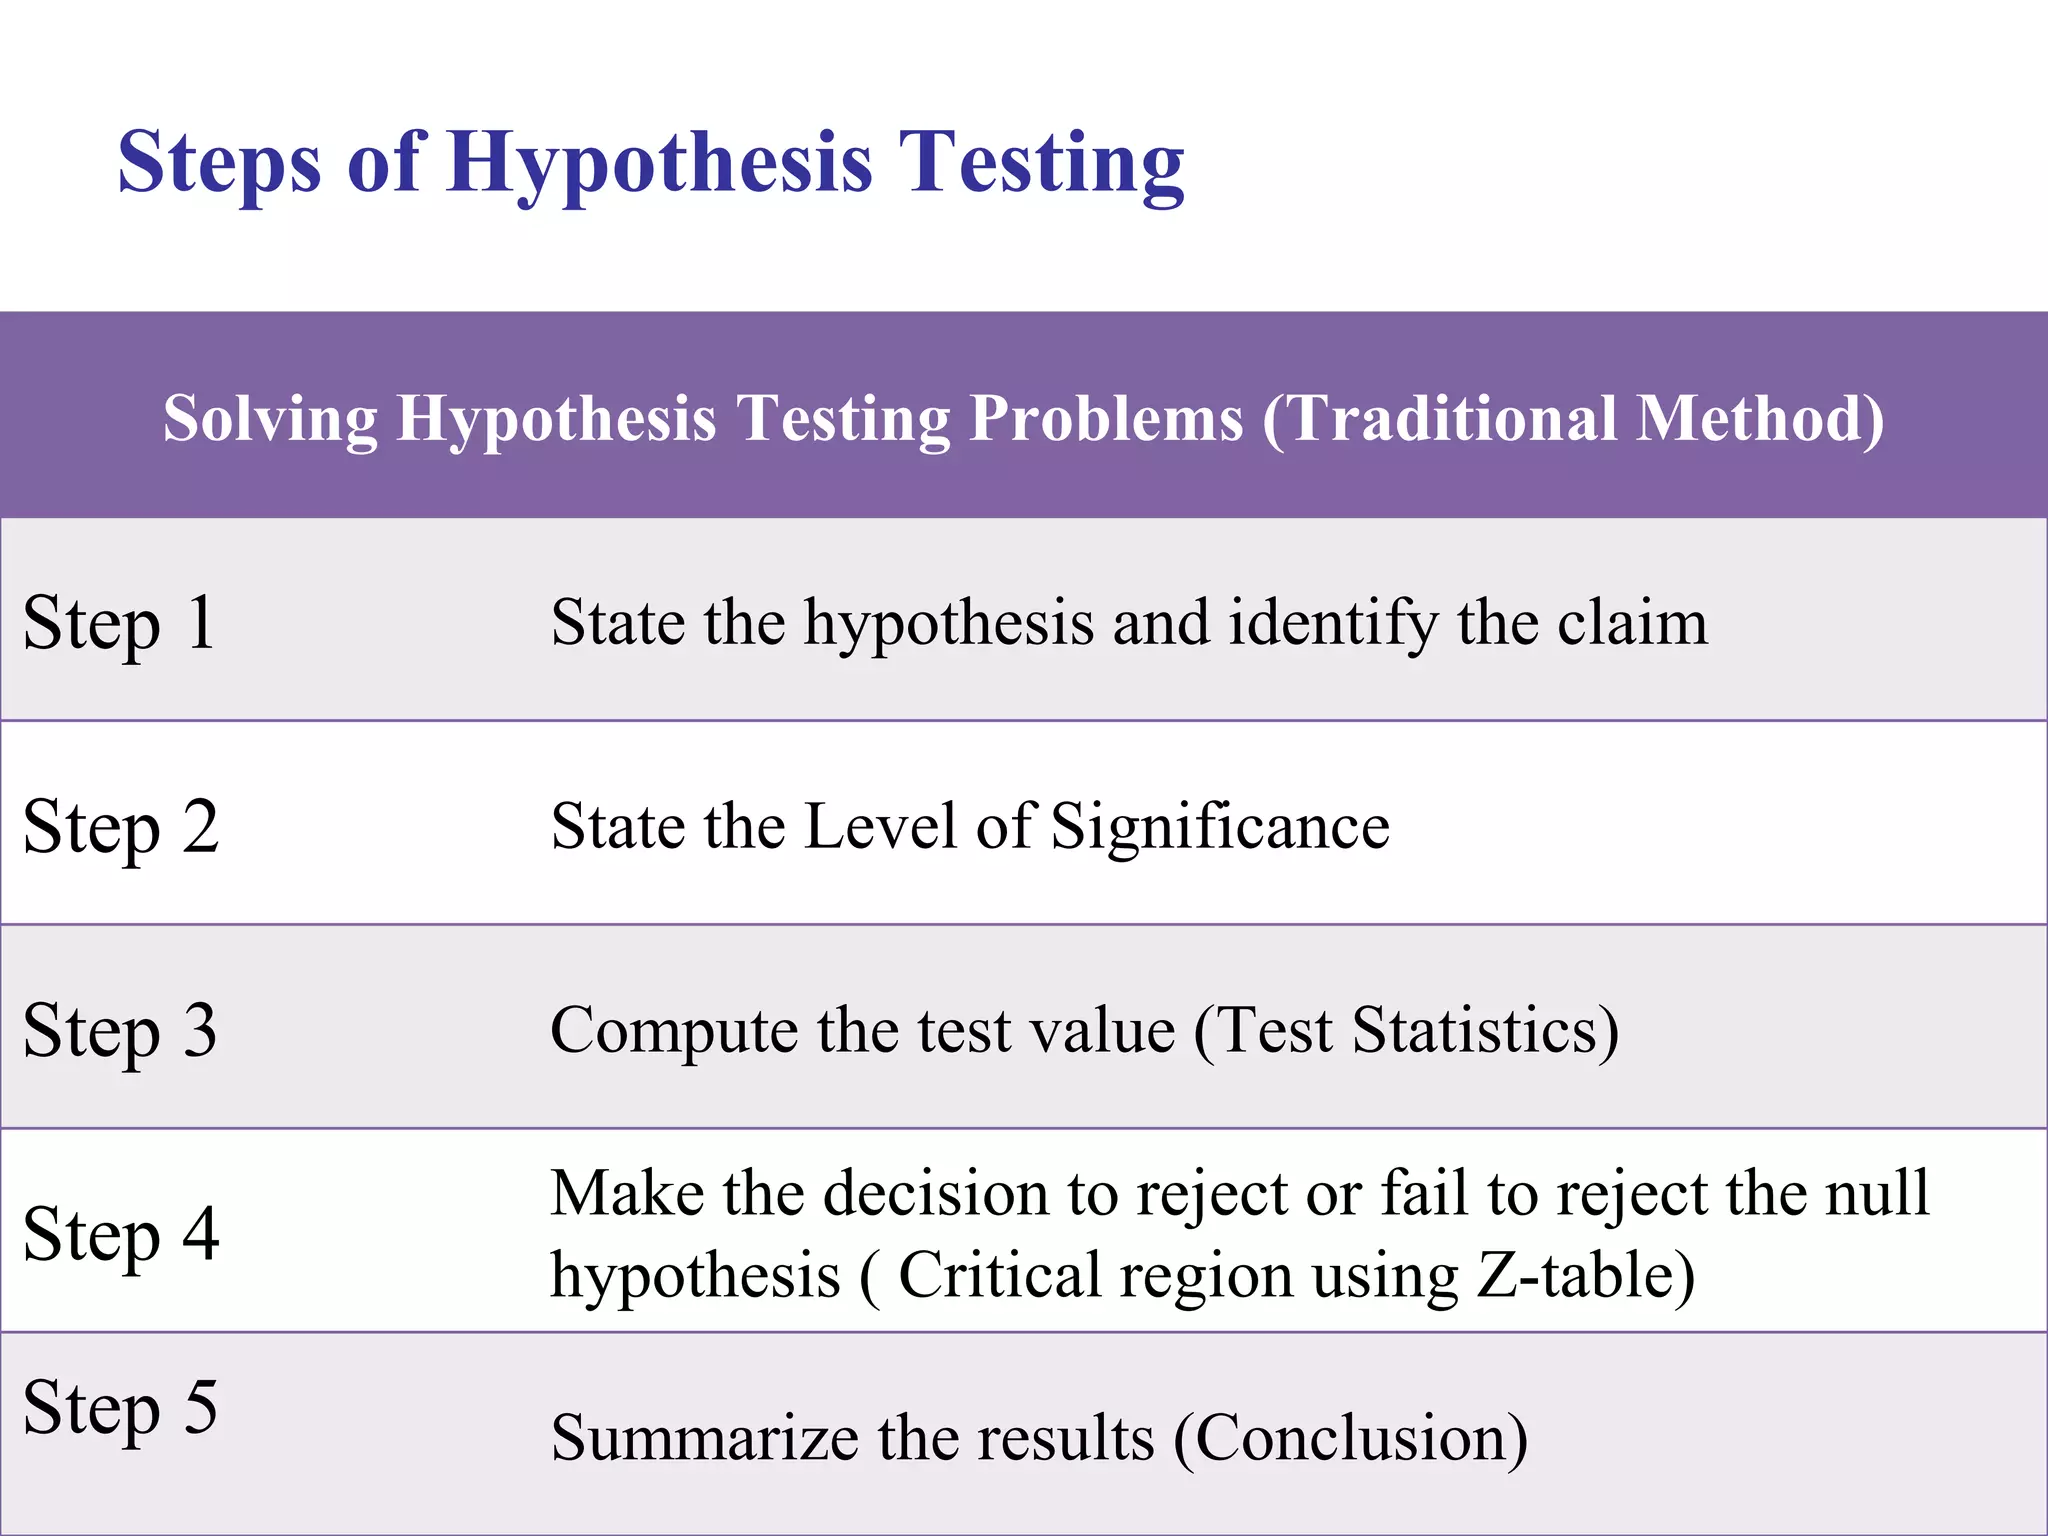
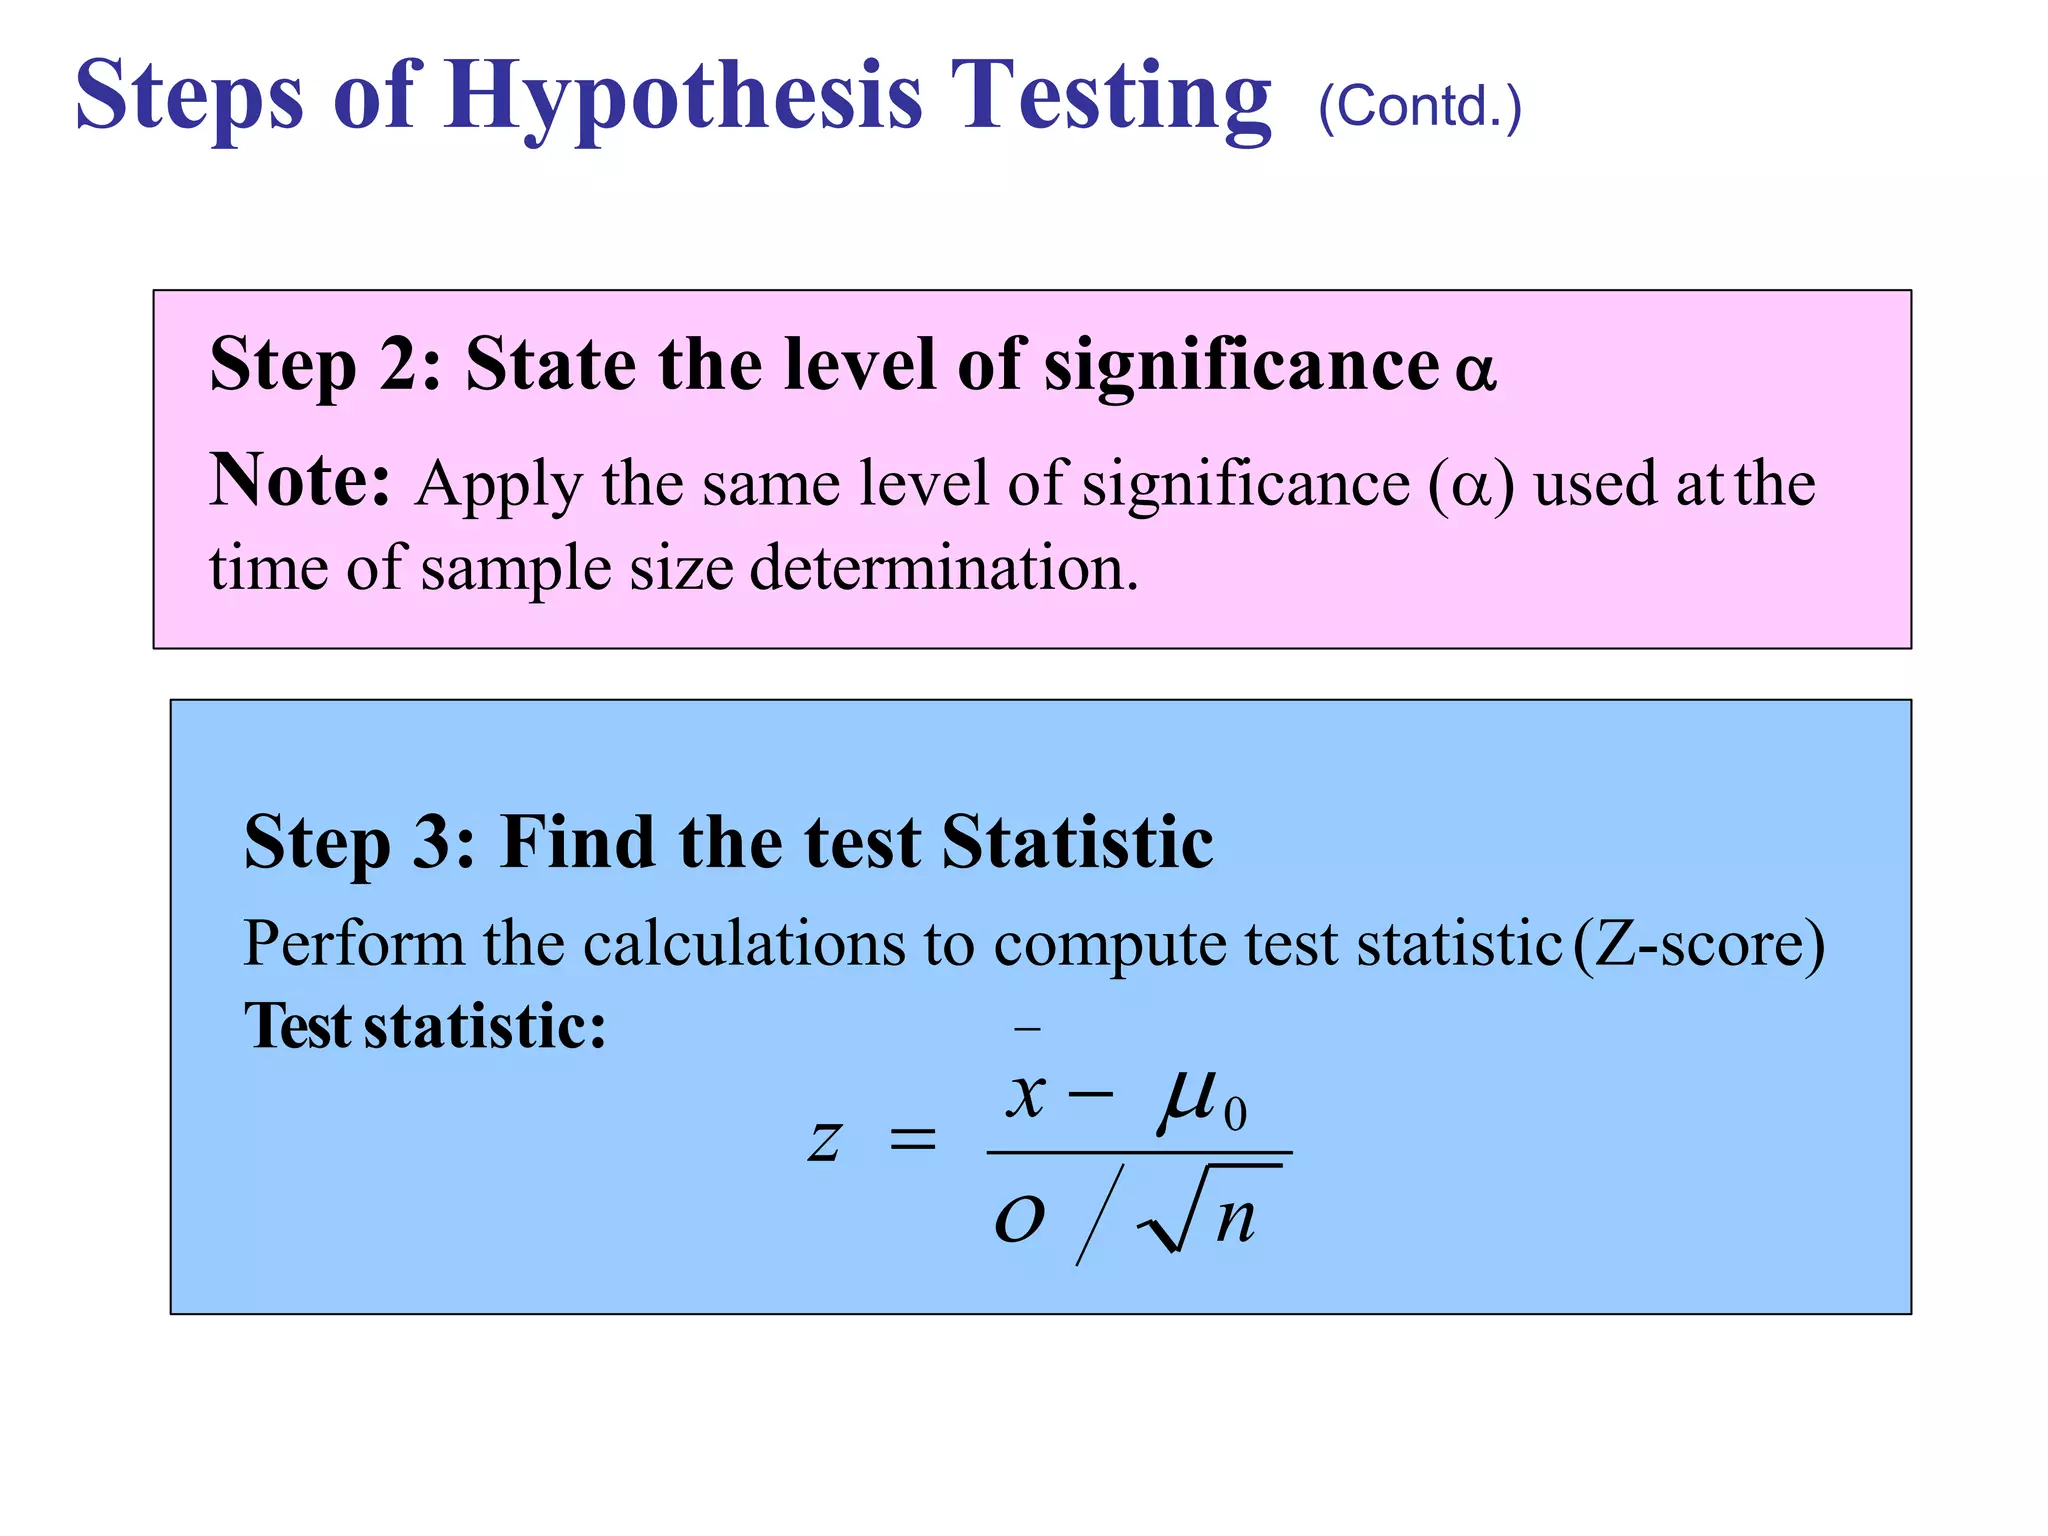
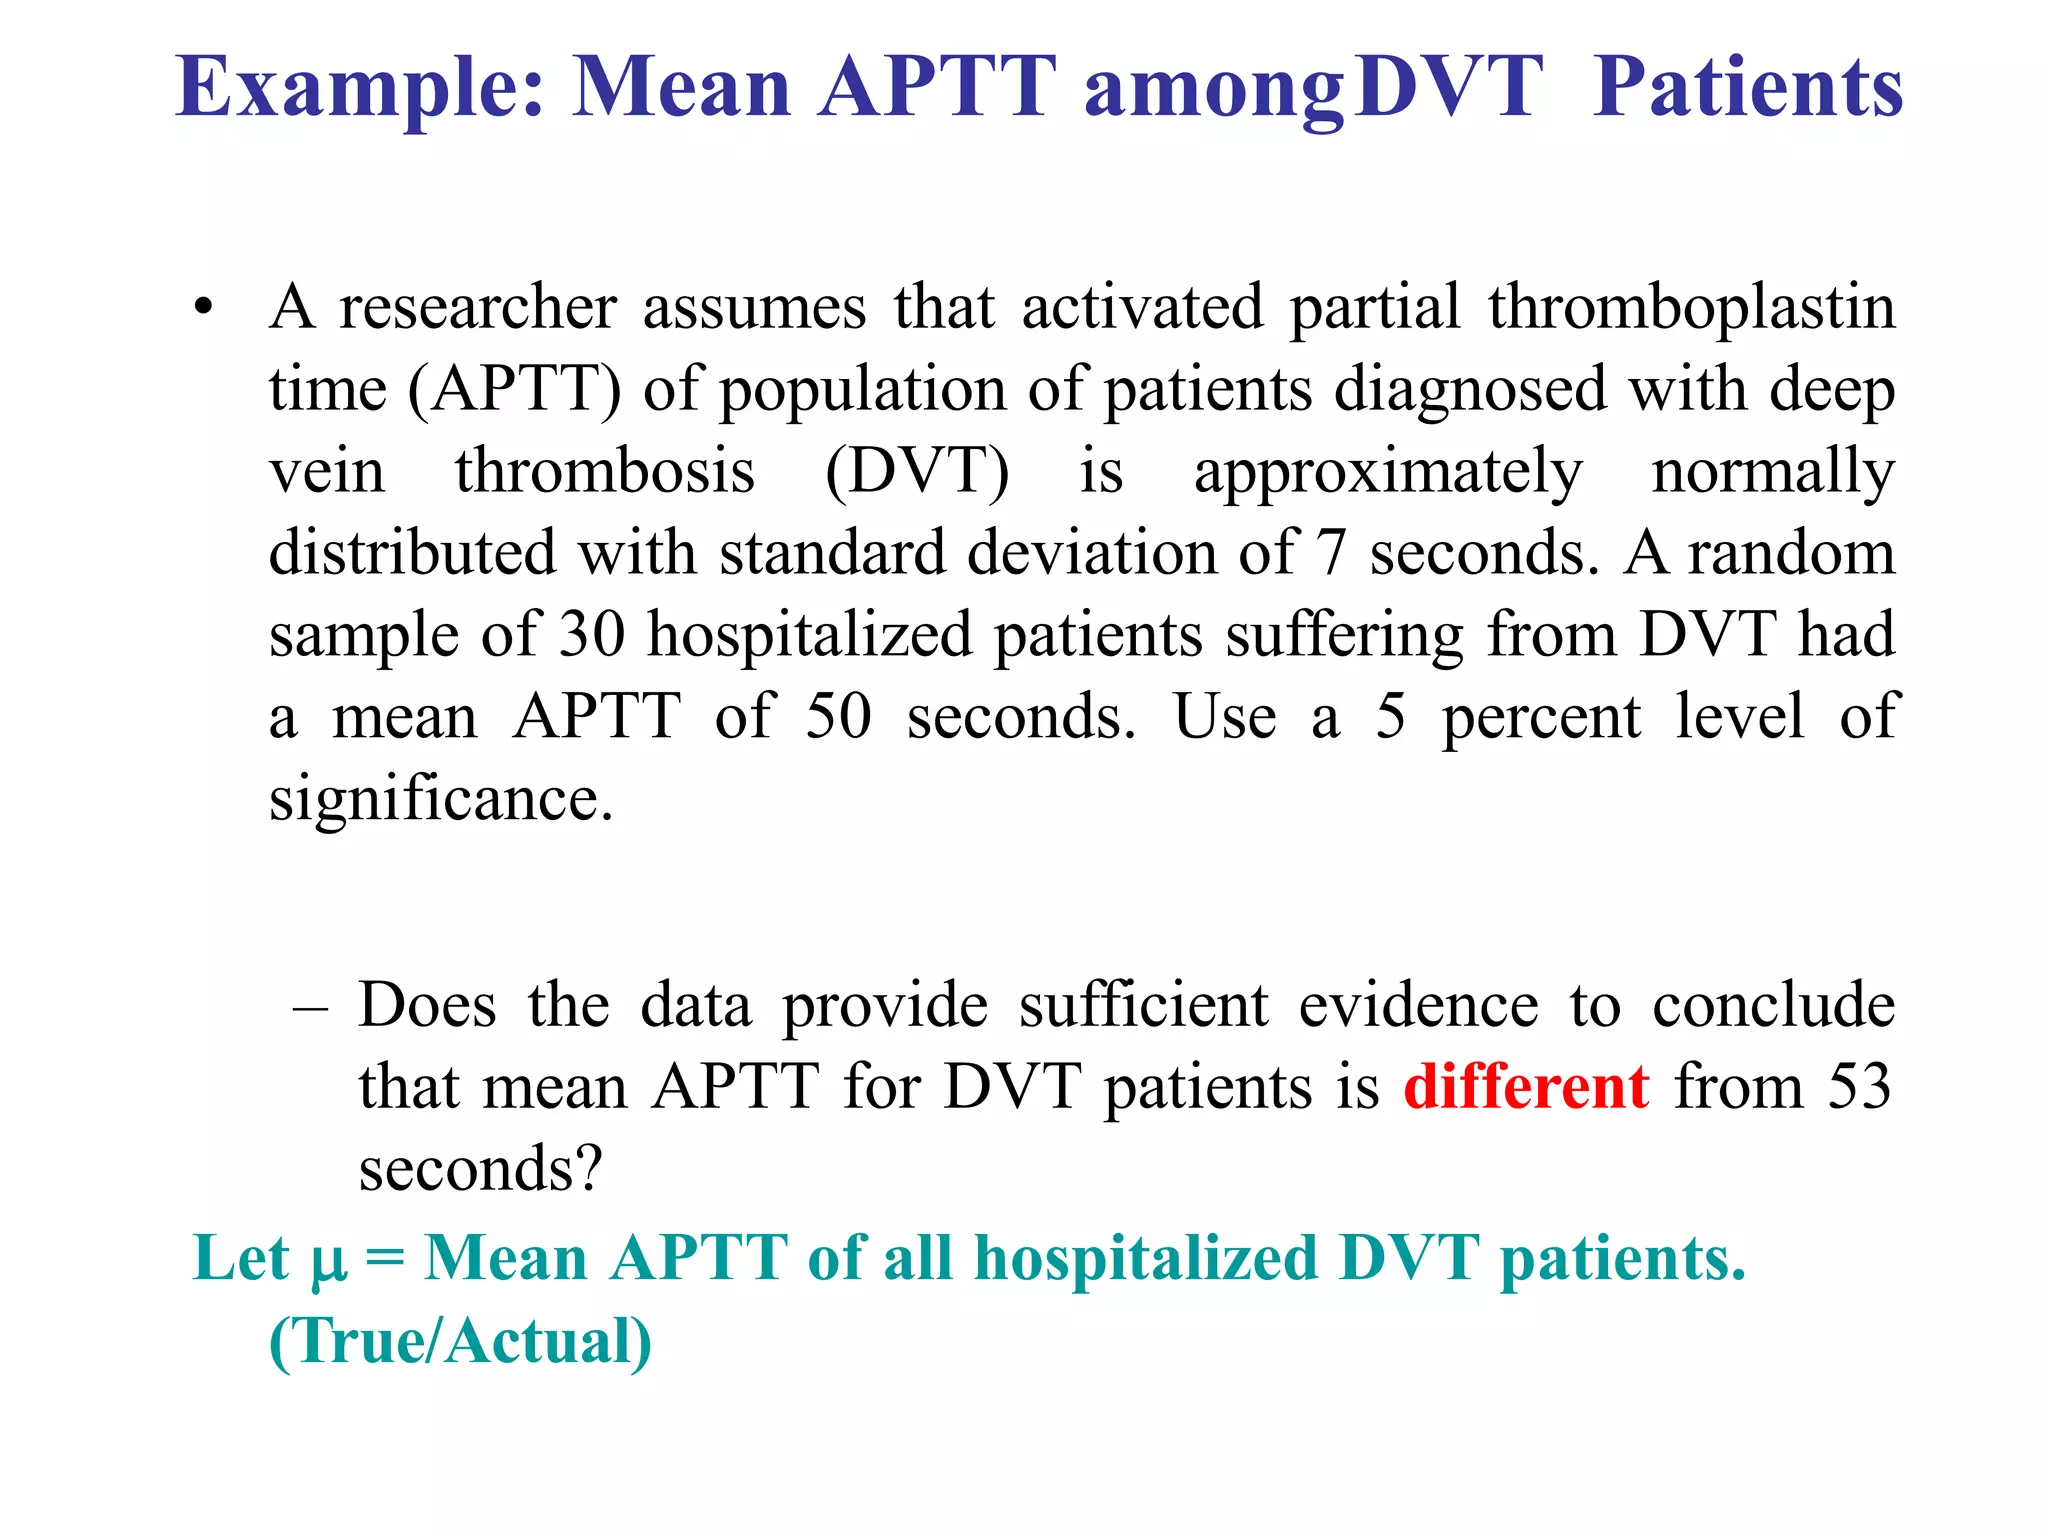
1
Hypothesis Testing: Null &
Alternative Hypotheses &
Significance level
Shakir Rahman
BScN, MScN, MSc Applied Psychology, PhD Nursing (Candidate)
University of Minnesota USA.
Principal & Assistant Professor
Ayub International College of Nursing & AHS Peshawar
Visiting Faculty
Swabi College of Nursing & Health Sciences Swabi
Nowshera College of Nursing & Health Sciences Nowshera
3
Objectives
By the end of this session, the learners would be able to:
• Understand the elements of hypothesis testing for testing
a population mean (for large sample):
• Identify appropriate null and alternative hypotheses
• Select a level of significance
• Compute the value of test statistic
• Locate a critical or rejection region
• Interpret the appropriate conclusion
Statistics
Descriptive Inferential
Estimation Hypothesis
testing
Point Estimation
Interval Estimation
(CI)
4
5
Statistical Inference
Inferential Statistics
It consists of methods for measuring and
drawing conclusion about a population based
on information obtained from a sample
- Estimation (Point & Interval Estimation)
- Significance/ Hypothesis Testing
HYPOTHESIS: A CLAIM
Claim
6
7
Why Hypothesis testing? To
answer….
• Will a new medication lower a person’s blood pressure?
• Is a new teaching strategy better than a traditionalone?
• Will seat belts reduce the severity of injuries causedby
accidents?
• Do college students spend more than 2 hours watchingTV
each day?
7
Hypothesis Testing:
• Tentative assumption related to certain
phenomenon which a researcher want to verify
• Allows us to use sample data to test a claim about
a population, such as testing whether a population
mean equals same number.
Example1 : Does an average
box of cereal contain 368
grams of cereal?
368 gm.
Hypothesis Testing:
• Allows us to use sample data to test a claim
about a population, such as testing whether a
population mean equals same number.
Example 2 : Do BSc. Nursing
students spend more than 6hours
in Library studying Biostatistics
per week?
9
Hypothesis
• Hypothesis: An informed guess or a conjecture about a
population parameter, which may or may not be true. It tests
whether a population parameter is less than, greater than, or
equal to a specified value (hypothetical).
Population
Sample
Inference
Statistic
Parameter
1
0
• Frequent users of narcotics have a mean anger expression score higher
than for non-users. (40).
• A cardiologist claimed that men between the age 40-60 years, who have
had a myocardial infarction have mean serum cholesterol level different
from general population(242mg/dl.).
• The mean balance score to assess muscle function among rheumatoid
arthritis (RA) patients is lower than osteo-arthritis (OA) patients(4).
10
What is hypothesis?
A statement of belief used in the evaluation of a
such as the mean of a
population parameter
population ().
Examples:
1
1
1
2
3
4
5
State null
and
Alternative
hypotheses
Level of
significance
= α
TestStatistics
Critical
region
Steps of Hypothesis Testing Conclusion
Types of hypotheses
There are two types of hypotheses:
Null hypothesis (H0) - A claim that there is no
difference between the population parameter and the
hypothesized value. For example, the mean of a
population () equals the hypothesized value 0.
Alternative or Researcher hypothesis (Ha or
H1) - A claim that disagrees with the null hypothesis.
For example, the mean of a population () is not
equal to the hypothesized value 0.
Examples of Null & Alternative hypotheses
Null hypothesis:
• Frequent users of narcotics have a mean anger expression score lower than or
equal for nonusers of narcotics (40).
• Men between the age 40-60 years, who have had a myocardial infarctionhave
mean serum cholesterol level similar to the general population (242mg/dl.).
• The mean balance score to assess muscle function among rheumatoidarthritis
(RA) patients is greater than or equal to the osteo-arthritis (OA) patients(4).
Alternative or Researcherhypothesis:
• Frequent users of narcotics have a mean anger expression score higher than for
nonusers of narcotics (40).
• A cardiologist claimed that men between the age 40-60 years, who have had a
myocardial infarction have mean serum cholesterol level different from general
population (242mg/dl.).
• The mean balance score to assess muscle function among rheumatoid arthritis
(RA) patients is lower than the osteo-arthritis (OA) patients(4).
H0 :  0
Ha :   0
H0 :   0
Ha :  0
H0 :   0
Ha :  0
Hypothesis Forms for Means
Test of Hypothesis
H0: µ = 45 H0: µ≤ 45 H0: µ ≥45
Ha: µ≠45 Ha: µ>45 Ha: µ<45
Two-tailed for Ha 16
Directional or Non-directional Hypotheses
One tailed hypotheses are directional; two-tailed hypothesis is
otherwise non-directional
Alternative hypothesis (Ha):
One-tailed, upper tail  Ha:  > 0
One-tailed, lower tail  Ha:  <  0
Two-tailed  Ha:    0
Null hypothesis (H0):
One-tailed, upper tail for Ha  H0 :   0
One-tailed, lower tail for Ha  H0:   0
 H0 :  = 0
Null & Alternative Hypothesis
• The mean number of patients per day in a clinic duringthe
month of July is 150
• On the average, children attend schools within 3.1kilometers
of their homes in Hyderabad
• The average stay in the burn-ward of Civil hospital is atleast
24 days
• The average life span in Pakistan is at least 55 yrs
• Has the average community level of suspendedparticulate
exceeded 35 units per cubic meter for thismonth?
• Does mean age of onset of a certain acute disease forschool
children differ from 10.4?
• A psychologist claims that the average IQ of a sample of 50
children is significantly above the normal IQ of100
Underlying assumptions for testing of
hypothesis for population mean
• The sample has been randomly selected from the
population or process.
• The underlying population is normally distributed (or if
not normally distributed, then n is large say greater than
or equal to 30).
• Population variance (2) either known or sample
variance (s2) assumed to be approximately equal to
population variance (2), when n is large.
Basic Elements of Testing Hypothesis
1. Null Hypothesis
2. Alternative Hypothesis (ResearcherHypothesis)
3. Choice of appropriate level of significance ()
4. Assumptions
5. Test Statistic (Formula): Application of sample results in
the formula to calculate the value of test statistic use for
decision purpose.
6. Rejection Region (Critical Region): Based on alternative
hypothesis and level of significance ().
7. Conclusion: If the calculated value of the test statistic
falls in the rejection region, reject H0 in favor of Ha,
otherwise fail to reject H0 .
Steps of Hypothesis Testing
Solving Hypothesis Testing Problems (Traditional Method)
Step 1 State the hypothesis and identify the claim
Step 2 State the Level of Significance
Step 3 Compute the test value (Test Statistics)
Step 4
Make the decision to reject or fail to reject the null
hypothesis ( Critical region using Z-table)
Step 5 Summarize the results (Conclusion)
Steps of Hypothesis testing
Step1
H0 :  0
Ha :   0
Write down the appropriate
null (H0) and alternative (Ha)
hypotheses. (Write H0 and
Ha as mathematical statements
H0 :   0
Ha :  0
H0 :   0
Ha :  0
Steps of Hypothesis Testing (Contd.)
Step 2: State the level of significance 
Note: Apply the same level of significance () used atthe
time of sample size determination.
Step 3: Find the test Statistic
Perform the calculations to compute test statistic(Z-score)
Teststatistic:
 n
z 
x  0

Steps of Hypothesis Testing (Contd.)
Step 4: Determine the critical region using Z-
table
The critical region is also known as Rejectionregion.
When the computed test statistic falls in the rejection
region we reject the null hypothesis in favor of the
alternative hypothesis
Reject Ho if,
Zcal < -Ztab
Zcal > Ztab
Zcal > Ztab OR Zcal <-Ztab
H a :   0
a
H :    0
H a :   0
Steps in a Hypothesis Test
(Contd.)
Step 5: Conclusion
Every hypothesis test ends with the experimenters (you and I) either
• Rejecting the Null Hypothesis, or
• Failing to Reject the Null Hypothesis
As strange as it may seem, you never ACCEPT the Null Hypothesis.
The best you can ever say about the Null Hypothesis is that you don’t
have enough evidence, based on a sample, to rejectit!
How: Decision is made on the basis of test statistic and critical region. If
the calculated value of the test statistic falls in the rejection region, reject
H0 in favor of Ha, otherwise fail to reject H0.
CONCLUSION
Presumed innocent:
Defendant is innocent = Null hypothesis
Remained innocent: Do not feel guilty
Fail to reject null hypothesis
Blame proven: Culprit behind the bar
Reject null hypothesis
Two tailed test with 5% (α)
1- α = 95% i.e. 0.95
α = 5% i.e. 0.05
α/2 = 0.025
1- α = 95%
α/2 = 0.025 α/2 = 0.025
0.475 0.475
-1.96 1.96
Two tailed test with 1% (α)
1- α = 99% i.e. 0.99
α = 1% i.e. 0.01
α/2 = 0.005
1- α = 99%
α/2 = 0.005 α/2 = 0.005
0.495 0.495
-2.58 2.58
Right tailed test with 5% (α)
1- α = 95% i.e. 0.95
α = 5% i.e. 0.05
1- α = 95%
α = 0.05
0.45
1.64
Right tailed test with 1% (α)
1- α = 99% i.e. 0.99
α = 1% i.e. 0.01
1- α = 99%
α = 0.01
0.49
2.33
Left tailed test with 5% (α)
1- α = 95% i.e. 0.95
α = 5% i.e. 0.05
1- α = 95%
α = 0.05 0.45
-1.64
Left tailed test with 1% (α)
1- α = 99% i.e. 0.99
α = 1% i.e. 0.01
1- α = 99%
α = 0.01 0.49
-2.33
Tryingtoprovetheparameters
“less than”
29
One-tailed, lower tail  Ha:  < 0 Z> -Z
Tryingtoprovetheparameter ismorethan
34
One-tailed, upper tail  Ha:  > 0 Z>Z
Tryingtoprovetheparameteris “not
equalto”or“different than”
31
Two-tailed  Ha:   0  Z>Z/2 and Z< -Z/2
Common Values of 
 Z  Z /2
0.10 1.28 1.645
0.05 1.645 1.96
0.01 2.32 2.575
Example: Mean APTT amongDVT Patients
• A researcher assumes that activated partial thromboplastin
time (APTT) of population of patients diagnosed with deep
vein thrombosis (DVT) is approximately normally
distributed with standard deviation of 7 seconds. A random
sample of 30 hospitalized patients suffering from DVT had
a mean APTT of 50 seconds. Use a 5 percent level of
significance.
– Does the data provide sufficient evidence to conclude
that mean APTT for DVT patients is different from 53
seconds?
Let  = Mean APTT of all hospitalized DVT patients.
(True/Actual)
36
Example: MeanAPTT among DVT patients (Contd.)
Hypothesis  Description
Step 1: Stating null & alternativehypothesis
 Ho :  =53 seconds  The meanAPTT of DVT patients is equal to 53
seconds.
 Ha :  ≠53 seconds  The meanAPTT of DVT patients is different from
53 seconds.
 Step 2: Level of significance (α) = 0.05
 Step 3: TestStatistic
n  3 0 ; x  5 0
  2 . 3 5
1 . 28
5 0  5 3
7
 3
0
  5 3 ;   7
Z  
 n
3 0
z 
x  0

TableValue:
 0.5 – 0.025 =0.4750
α/2
Z = ±1.96 (CriticalValue)
Significance Level:
α = 0.05  α/2=0.05/2=0.025
(Area above or below CriticalValue)
0.5
0.4
0.3
0.2
0.1
0
-3 -2 -1 0 1 2 3
z Area aboveZ
37
Critical
Region
Step 4: Critical Region
Ha:   53  Z>1.96 and Z<-1.96
Step 5: Conclusion
The calculated value of the test statistic (Zcal=-2.35) falls in
the rejection region, so, we are rejecting our null hypothesis.
i.e. The mean APTT of DVT patients is different from 53
seconds.
Example: Mean APTT among DVT patients (Contd.)
-1.96 1.96
References
• Bluman, A. (2004). Elementary statistics: A
step by step approach. Boston: Mc Graw Hill.
Acknowledgements
Dr Tazeen Saeed Ali
RM, RM, BScN, MSc ( Epidemiology &
Biostatistics), Phd (Medical Sciences), Post
Doctorate (Health Policy & Planning)
Associate Dean School of Nursing & Midwifery
The Aga Khan University Karachi.
Kiran Ramzan Ali Lalani
BScN, MSc Epidemiology & Biostatistics (Candidate)
Registered Nurse (NICU)
Aga Khan University Hospital
Lecture 7 Hypothesis testing.pptx

Lecture 7 Hypothesis testing.pptx

  • 2.
    1 Hypothesis Testing: Null& Alternative Hypotheses & Significance level Shakir Rahman BScN, MScN, MSc Applied Psychology, PhD Nursing (Candidate) University of Minnesota USA. Principal & Assistant Professor Ayub International College of Nursing & AHS Peshawar Visiting Faculty Swabi College of Nursing & Health Sciences Swabi Nowshera College of Nursing & Health Sciences Nowshera
  • 3.
    3 Objectives By the endof this session, the learners would be able to: • Understand the elements of hypothesis testing for testing a population mean (for large sample): • Identify appropriate null and alternative hypotheses • Select a level of significance • Compute the value of test statistic • Locate a critical or rejection region • Interpret the appropriate conclusion
  • 4.
  • 5.
    5 Statistical Inference Inferential Statistics Itconsists of methods for measuring and drawing conclusion about a population based on information obtained from a sample - Estimation (Point & Interval Estimation) - Significance/ Hypothesis Testing
  • 6.
  • 7.
    7 Why Hypothesis testing?To answer…. • Will a new medication lower a person’s blood pressure? • Is a new teaching strategy better than a traditionalone? • Will seat belts reduce the severity of injuries causedby accidents? • Do college students spend more than 2 hours watchingTV each day?
  • 8.
    7 Hypothesis Testing: • Tentativeassumption related to certain phenomenon which a researcher want to verify • Allows us to use sample data to test a claim about a population, such as testing whether a population mean equals same number. Example1 : Does an average box of cereal contain 368 grams of cereal? 368 gm.
  • 9.
    Hypothesis Testing: • Allowsus to use sample data to test a claim about a population, such as testing whether a population mean equals same number. Example 2 : Do BSc. Nursing students spend more than 6hours in Library studying Biostatistics per week? 9
  • 10.
    Hypothesis • Hypothesis: Aninformed guess or a conjecture about a population parameter, which may or may not be true. It tests whether a population parameter is less than, greater than, or equal to a specified value (hypothetical). Population Sample Inference Statistic Parameter 1 0
  • 11.
    • Frequent usersof narcotics have a mean anger expression score higher than for non-users. (40). • A cardiologist claimed that men between the age 40-60 years, who have had a myocardial infarction have mean serum cholesterol level different from general population(242mg/dl.). • The mean balance score to assess muscle function among rheumatoid arthritis (RA) patients is lower than osteo-arthritis (OA) patients(4). 10 What is hypothesis? A statement of belief used in the evaluation of a such as the mean of a population parameter population (). Examples:
  • 12.
    1 1 1 2 3 4 5 State null and Alternative hypotheses Level of significance =α TestStatistics Critical region Steps of Hypothesis Testing Conclusion
  • 13.
    Types of hypotheses Thereare two types of hypotheses: Null hypothesis (H0) - A claim that there is no difference between the population parameter and the hypothesized value. For example, the mean of a population () equals the hypothesized value 0. Alternative or Researcher hypothesis (Ha or H1) - A claim that disagrees with the null hypothesis. For example, the mean of a population () is not equal to the hypothesized value 0.
  • 14.
    Examples of Null& Alternative hypotheses Null hypothesis: • Frequent users of narcotics have a mean anger expression score lower than or equal for nonusers of narcotics (40). • Men between the age 40-60 years, who have had a myocardial infarctionhave mean serum cholesterol level similar to the general population (242mg/dl.). • The mean balance score to assess muscle function among rheumatoidarthritis (RA) patients is greater than or equal to the osteo-arthritis (OA) patients(4). Alternative or Researcherhypothesis: • Frequent users of narcotics have a mean anger expression score higher than for nonusers of narcotics (40). • A cardiologist claimed that men between the age 40-60 years, who have had a myocardial infarction have mean serum cholesterol level different from general population (242mg/dl.). • The mean balance score to assess muscle function among rheumatoid arthritis (RA) patients is lower than the osteo-arthritis (OA) patients(4).
  • 15.
    H0 : 0 Ha :   0 H0 :   0 Ha :  0 H0 :   0 Ha :  0 Hypothesis Forms for Means
  • 16.
    Test of Hypothesis H0:µ = 45 H0: µ≤ 45 H0: µ ≥45 Ha: µ≠45 Ha: µ>45 Ha: µ<45
  • 17.
    Two-tailed for Ha16 Directional or Non-directional Hypotheses One tailed hypotheses are directional; two-tailed hypothesis is otherwise non-directional Alternative hypothesis (Ha): One-tailed, upper tail  Ha:  > 0 One-tailed, lower tail  Ha:  <  0 Two-tailed  Ha:    0 Null hypothesis (H0): One-tailed, upper tail for Ha  H0 :   0 One-tailed, lower tail for Ha  H0:   0  H0 :  = 0
  • 18.
    Null & AlternativeHypothesis • The mean number of patients per day in a clinic duringthe month of July is 150 • On the average, children attend schools within 3.1kilometers of their homes in Hyderabad • The average stay in the burn-ward of Civil hospital is atleast 24 days • The average life span in Pakistan is at least 55 yrs • Has the average community level of suspendedparticulate exceeded 35 units per cubic meter for thismonth? • Does mean age of onset of a certain acute disease forschool children differ from 10.4? • A psychologist claims that the average IQ of a sample of 50 children is significantly above the normal IQ of100
  • 19.
    Underlying assumptions fortesting of hypothesis for population mean • The sample has been randomly selected from the population or process. • The underlying population is normally distributed (or if not normally distributed, then n is large say greater than or equal to 30). • Population variance (2) either known or sample variance (s2) assumed to be approximately equal to population variance (2), when n is large.
  • 20.
    Basic Elements ofTesting Hypothesis 1. Null Hypothesis 2. Alternative Hypothesis (ResearcherHypothesis) 3. Choice of appropriate level of significance () 4. Assumptions 5. Test Statistic (Formula): Application of sample results in the formula to calculate the value of test statistic use for decision purpose. 6. Rejection Region (Critical Region): Based on alternative hypothesis and level of significance (). 7. Conclusion: If the calculated value of the test statistic falls in the rejection region, reject H0 in favor of Ha, otherwise fail to reject H0 .
  • 21.
    Steps of HypothesisTesting Solving Hypothesis Testing Problems (Traditional Method) Step 1 State the hypothesis and identify the claim Step 2 State the Level of Significance Step 3 Compute the test value (Test Statistics) Step 4 Make the decision to reject or fail to reject the null hypothesis ( Critical region using Z-table) Step 5 Summarize the results (Conclusion)
  • 22.
    Steps of Hypothesistesting Step1 H0 :  0 Ha :   0 Write down the appropriate null (H0) and alternative (Ha) hypotheses. (Write H0 and Ha as mathematical statements H0 :   0 Ha :  0 H0 :   0 Ha :  0
  • 23.
    Steps of HypothesisTesting (Contd.) Step 2: State the level of significance  Note: Apply the same level of significance () used atthe time of sample size determination. Step 3: Find the test Statistic Perform the calculations to compute test statistic(Z-score) Teststatistic:  n z  x  0 
  • 24.
    Steps of HypothesisTesting (Contd.) Step 4: Determine the critical region using Z- table The critical region is also known as Rejectionregion. When the computed test statistic falls in the rejection region we reject the null hypothesis in favor of the alternative hypothesis Reject Ho if, Zcal < -Ztab Zcal > Ztab Zcal > Ztab OR Zcal <-Ztab H a :   0 a H :    0 H a :   0
  • 25.
    Steps in aHypothesis Test (Contd.) Step 5: Conclusion Every hypothesis test ends with the experimenters (you and I) either • Rejecting the Null Hypothesis, or • Failing to Reject the Null Hypothesis As strange as it may seem, you never ACCEPT the Null Hypothesis. The best you can ever say about the Null Hypothesis is that you don’t have enough evidence, based on a sample, to rejectit! How: Decision is made on the basis of test statistic and critical region. If the calculated value of the test statistic falls in the rejection region, reject H0 in favor of Ha, otherwise fail to reject H0.
  • 26.
    CONCLUSION Presumed innocent: Defendant isinnocent = Null hypothesis Remained innocent: Do not feel guilty Fail to reject null hypothesis Blame proven: Culprit behind the bar Reject null hypothesis
  • 27.
    Two tailed testwith 5% (α) 1- α = 95% i.e. 0.95 α = 5% i.e. 0.05 α/2 = 0.025 1- α = 95% α/2 = 0.025 α/2 = 0.025 0.475 0.475 -1.96 1.96
  • 28.
    Two tailed testwith 1% (α) 1- α = 99% i.e. 0.99 α = 1% i.e. 0.01 α/2 = 0.005 1- α = 99% α/2 = 0.005 α/2 = 0.005 0.495 0.495 -2.58 2.58
  • 29.
    Right tailed testwith 5% (α) 1- α = 95% i.e. 0.95 α = 5% i.e. 0.05 1- α = 95% α = 0.05 0.45 1.64
  • 30.
    Right tailed testwith 1% (α) 1- α = 99% i.e. 0.99 α = 1% i.e. 0.01 1- α = 99% α = 0.01 0.49 2.33
  • 31.
    Left tailed testwith 5% (α) 1- α = 95% i.e. 0.95 α = 5% i.e. 0.05 1- α = 95% α = 0.05 0.45 -1.64
  • 32.
    Left tailed testwith 1% (α) 1- α = 99% i.e. 0.99 α = 1% i.e. 0.01 1- α = 99% α = 0.01 0.49 -2.33
  • 33.
  • 34.
  • 35.
  • 36.
    Common Values of  Z  Z /2 0.10 1.28 1.645 0.05 1.645 1.96 0.01 2.32 2.575
  • 37.
    Example: Mean APTTamongDVT Patients • A researcher assumes that activated partial thromboplastin time (APTT) of population of patients diagnosed with deep vein thrombosis (DVT) is approximately normally distributed with standard deviation of 7 seconds. A random sample of 30 hospitalized patients suffering from DVT had a mean APTT of 50 seconds. Use a 5 percent level of significance. – Does the data provide sufficient evidence to conclude that mean APTT for DVT patients is different from 53 seconds? Let  = Mean APTT of all hospitalized DVT patients. (True/Actual)
  • 38.
    36 Example: MeanAPTT amongDVT patients (Contd.) Hypothesis  Description Step 1: Stating null & alternativehypothesis  Ho :  =53 seconds  The meanAPTT of DVT patients is equal to 53 seconds.  Ha :  ≠53 seconds  The meanAPTT of DVT patients is different from 53 seconds.  Step 2: Level of significance (α) = 0.05  Step 3: TestStatistic n  3 0 ; x  5 0   2 . 3 5 1 . 28 5 0  5 3 7  3 0   5 3 ;   7 Z    n 3 0 z  x  0 
  • 39.
    TableValue:  0.5 –0.025 =0.4750 α/2 Z = ±1.96 (CriticalValue) Significance Level: α = 0.05  α/2=0.05/2=0.025 (Area above or below CriticalValue) 0.5 0.4 0.3 0.2 0.1 0 -3 -2 -1 0 1 2 3 z Area aboveZ 37
  • 40.
  • 41.
    Step 4: CriticalRegion Ha:   53  Z>1.96 and Z<-1.96 Step 5: Conclusion The calculated value of the test statistic (Zcal=-2.35) falls in the rejection region, so, we are rejecting our null hypothesis. i.e. The mean APTT of DVT patients is different from 53 seconds. Example: Mean APTT among DVT patients (Contd.) -1.96 1.96
  • 43.
    References • Bluman, A.(2004). Elementary statistics: A step by step approach. Boston: Mc Graw Hill.
  • 44.
    Acknowledgements Dr Tazeen SaeedAli RM, RM, BScN, MSc ( Epidemiology & Biostatistics), Phd (Medical Sciences), Post Doctorate (Health Policy & Planning) Associate Dean School of Nursing & Midwifery The Aga Khan University Karachi. Kiran Ramzan Ali Lalani BScN, MSc Epidemiology & Biostatistics (Candidate) Registered Nurse (NICU) Aga Khan University Hospital