Downloaded 2,911 times

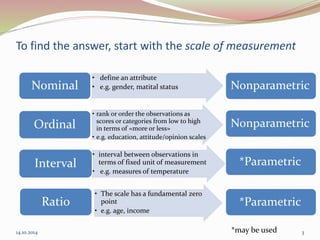
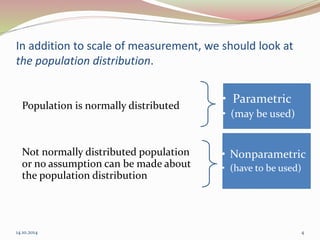
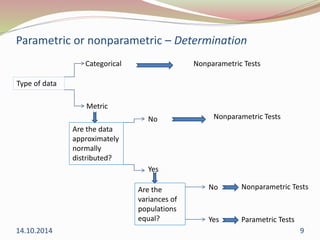
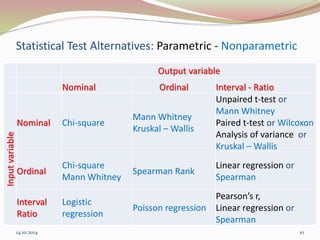


The document discusses the appropriate use of parametric and nonparametric statistical tests based on the scale of measurement and population distribution. It explains the characteristics of different data types (nominal, ordinal, interval, and ratio) and the conditions required for using parametric tests, including normal distribution and homogeneity of variance. The document provides a decision-making framework for selecting the appropriate statistical tests, detailing alternatives for various input and output variable types.


