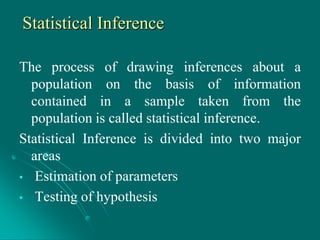
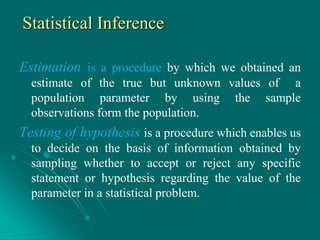
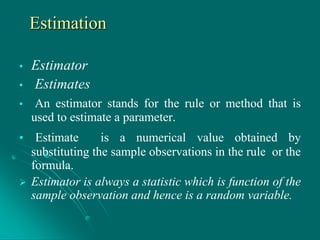
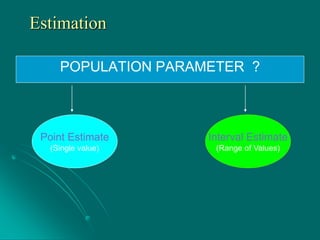
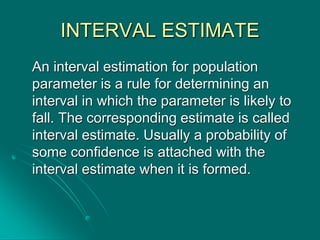
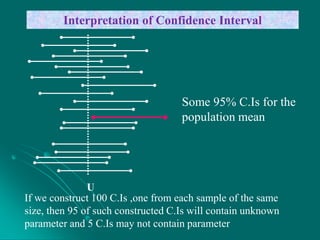
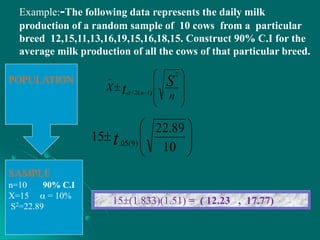
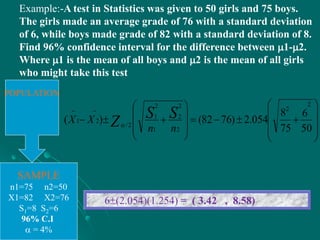
Statistical Inference
The process of drawing inferences about a
population on the basis of information
contained in a sample taken from the
population is called statistical inference.
Statistical Inference is divided into two major
areas
• Estimation of parameters
• Testing of hypothesis
Statistical Inference
Estimation is a procedure by which we obtained an
estimate of the true but unknown values of a
population parameter by using the sample
observations form the population.
Testing of hypothesis is a procedure which enables us
to decide on the basis of information obtained by
sampling whether to accept or reject any specific
statement or hypothesis regarding the value of the
parameter in a statistical problem.
Estimation
• Estimator
• Estimates
• An estimator stands for the rule or method that is
used to estimate a parameter.
• Estimate is a numerical value obtained by
substituting the sample observations in the rule or the
formula.
 Estimator is always a statistic which is function of the
sample observation and hence is a random variable.
Estimation
POPULATION PARAMETER ?
Interval Estimate
(Range of Values)
Point Estimate
(Single value)
INTERVAL ESTIMATE
An interval estimation for population
parameter is a rule for determining an
interval in which the parameter is likely to
fall. The corresponding estimate is called
interval estimate. Usually a probability of
some confidence is attached with the
interval estimate when it is formed.
Example:- A researcher wishes to estimate the average amount of money that a
student from university spends for food per day. A random sample of 36 students is
selected and the sample mean is found to be Rs 45 with standard deviation of Rs.3.
Estimate 90 % confidence limits for the average amount of money that the students
from the university spend on food per day.
POPULATION
SAMPLE
n=36 90% C.I
X=45  = 10%
S=3










n
X S
Z
2
2/









36
45 3
2
05.0Z
45(1.645)(0.5) = ( 44.18 , 45.82)
U
Some 95% C.Is for the
population mean
Interpretation of Confidence Interval
If we construct 100 C.Is ,one from each sample of the same
size, then 95 of such constructed C.Is will contain unknown
parameter and 5 C.Is may not contain parameter
Example:-The following data represents the daily milk
production of a random sample of 10 cows from a particular
breed 12,15,11,13,16,19,15,16,18,15. Construct 90% C.I for the
average milk production of all the cows of that particular breed.
POPULATION
SAMPLE
n=10 90% C.I
X=15  = 10%
S2=22.89
15(1.833)(1.51) = ( 12.23 , 17.77)








 

n
X St n
2
)1(2/









10
89.22
15 )9(05.t
Example:-A test in Statistics was given to 50 girls and 75 boys.
The girls made an average grade of 76 with a standard deviation
of 6, while boys made grade of 82 with a standard deviation of 8.
Find 96% confidence interval for the difference between 1-2.
Where 1 is the mean of all boys and 2 is the mean of all girls
who might take this test
POPULATION
SAMPLE
n1=75 n2=50
X1=82 X2=76
S1=8 S2=6
96% C.I
 = 4%
6(2.054)(1.254) = ( 3.42 , 8.58)





















50
6
75
8
054.2)7682()(
2
2
2
2
2
1
2
1
2/
21
nn
XX SS
Z

Statistical Inference

  • 1.
  • 2.
    Statistical Inference The processof drawing inferences about a population on the basis of information contained in a sample taken from the population is called statistical inference. Statistical Inference is divided into two major areas • Estimation of parameters • Testing of hypothesis
  • 3.
    Statistical Inference Estimation isa procedure by which we obtained an estimate of the true but unknown values of a population parameter by using the sample observations form the population. Testing of hypothesis is a procedure which enables us to decide on the basis of information obtained by sampling whether to accept or reject any specific statement or hypothesis regarding the value of the parameter in a statistical problem.
  • 4.
    Estimation • Estimator • Estimates •An estimator stands for the rule or method that is used to estimate a parameter. • Estimate is a numerical value obtained by substituting the sample observations in the rule or the formula.  Estimator is always a statistic which is function of the sample observation and hence is a random variable.
  • 5.
    Estimation POPULATION PARAMETER ? IntervalEstimate (Range of Values) Point Estimate (Single value)
  • 6.
    INTERVAL ESTIMATE An intervalestimation for population parameter is a rule for determining an interval in which the parameter is likely to fall. The corresponding estimate is called interval estimate. Usually a probability of some confidence is attached with the interval estimate when it is formed.
  • 7.
    Example:- A researcherwishes to estimate the average amount of money that a student from university spends for food per day. A random sample of 36 students is selected and the sample mean is found to be Rs 45 with standard deviation of Rs.3. Estimate 90 % confidence limits for the average amount of money that the students from the university spend on food per day. POPULATION SAMPLE n=36 90% C.I X=45  = 10% S=3           n X S Z 2 2/          36 45 3 2 05.0Z 45(1.645)(0.5) = ( 44.18 , 45.82)
  • 8.
    U Some 95% C.Isfor the population mean Interpretation of Confidence Interval If we construct 100 C.Is ,one from each sample of the same size, then 95 of such constructed C.Is will contain unknown parameter and 5 C.Is may not contain parameter
  • 9.
    Example:-The following datarepresents the daily milk production of a random sample of 10 cows from a particular breed 12,15,11,13,16,19,15,16,18,15. Construct 90% C.I for the average milk production of all the cows of that particular breed. POPULATION SAMPLE n=10 90% C.I X=15  = 10% S2=22.89 15(1.833)(1.51) = ( 12.23 , 17.77)            n X St n 2 )1(2/          10 89.22 15 )9(05.t
  • 10.
    Example:-A test inStatistics was given to 50 girls and 75 boys. The girls made an average grade of 76 with a standard deviation of 6, while boys made grade of 82 with a standard deviation of 8. Find 96% confidence interval for the difference between 1-2. Where 1 is the mean of all boys and 2 is the mean of all girls who might take this test POPULATION SAMPLE n1=75 n2=50 X1=82 X2=76 S1=8 S2=6 96% C.I  = 4% 6(2.054)(1.254) = ( 3.42 , 8.58)                      50 6 75 8 054.2)7682()( 2 2 2 2 2 1 2 1 2/ 21 nn XX SS Z