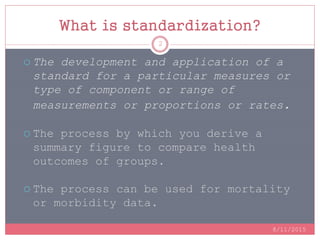
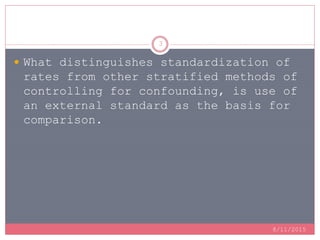
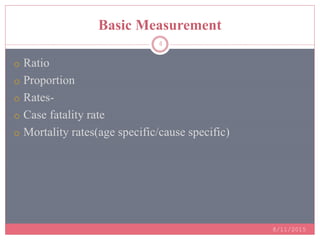
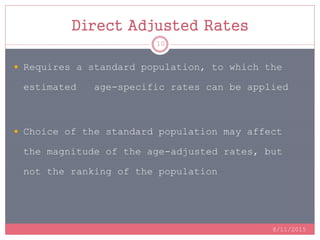
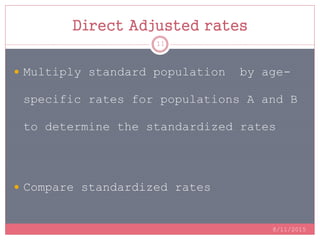
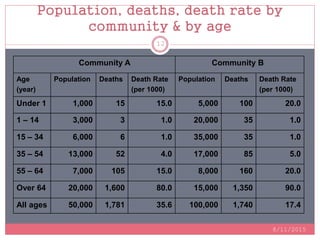
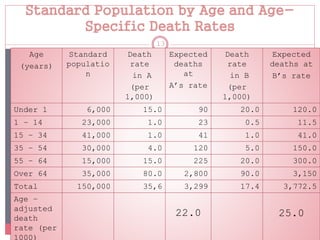
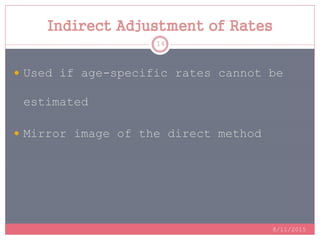
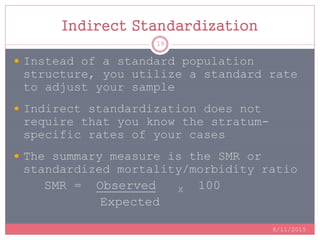
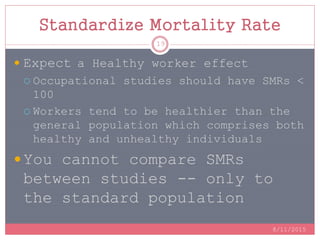
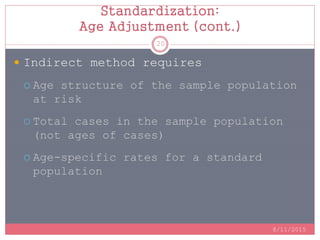
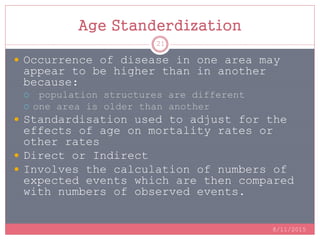
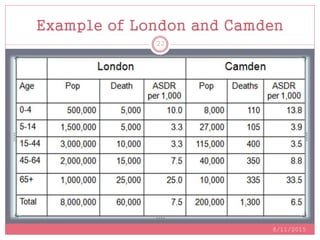
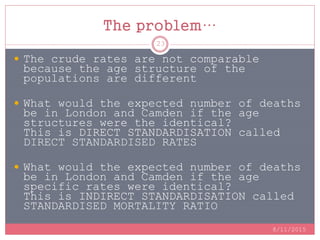
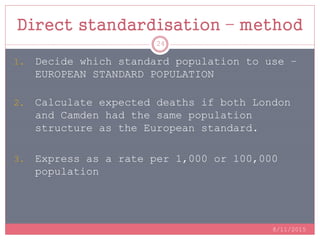
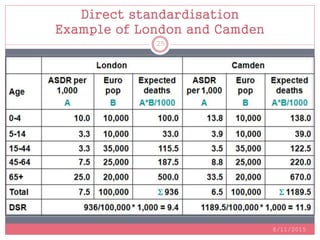
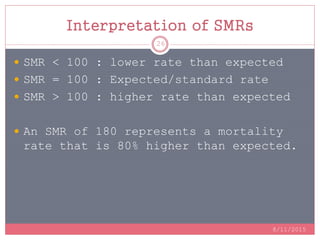
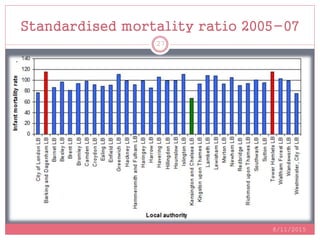
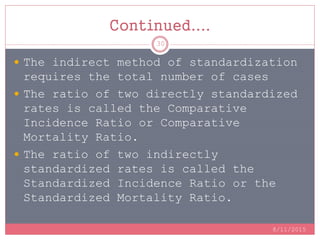
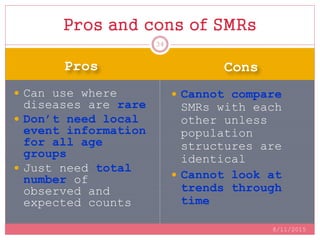
PRESENTED BY: DR.
KUNAL
GUIDED BY: DR.
ABHAY MUDEY
STANDERDIZATION
What is standardization?
 The development and application of a
standard for a particular measures or
type of component or range of
measurements or proportions or rates.
 The process by which you derive a
summary figure to compare health
outcomes of groups.
 The process can be used for mortality
or morbidity data.
8/11/2015
2
8/11/2015
3
 What distinguishes standardization of
rates from other stratified methods of
controlling for confounding, is use of
an external standard as the basis for
comparison.
Basic Measurement
8/11/2015
4
o Ratio
o Proportion
o Rates-
o Case fatality rate
o Mortality rates(age specific/cause specific)
Crude vs. standerdized
PREFER
REJECT
Uniform Localized
Adapted
Line shows
likelihood
of
correction
Standardization Of Rates
8/11/2015
6
 Used to reduce distortion in
comparisons between crude areas
 Also referred to as adjusting rates
Crude rate
8/11/2015
7
 Advantages
 Actual Summary rates
 Easy calculation for international comparisons
 Disadvantages
 Since population vary in composition (e.g.,
age)
differences in crude rates difficult to interpret
Specific Rate
8/11/2015
8
 Advantages
 Homogenous subgroups
 Detailed rates useful for public health and
 Epidemiological aims
 Disadvantages
 Cumbersome to compare subgroups of two or
 more populations
Adjusted Rates
8/11/2015
9
 Advantages
 Summary statement
 Differences in group composition “removed”
 allows unbiased comparison
 Disadvantages
 Fictional rates
 Absolute magnitude dependent on standard
 population chosen
 Opposing trends in subgroup masked
Direct Adjusted Rates
8/11/2015
10
 Requires a standard population, to which the
estimated age-specific rates can be applied
 Choice of the standard population may affect
the magnitude of the age-adjusted rates, but
not the ranking of the population
Direct Adjusted rates
8/11/2015
11
 Multiply standard population by age-
specific rates for populations A and B
to determine the standardized rates
 Compare standardized rates
Population, deaths, death rate by
community & by age
8/11/2015
12
Community A Community B
Age
(year)
Population Deaths Death Rate
(per 1000)
Population Deaths Death Rate
(per 1000)
Under 1 1,000 15 15.0 5,000 100 20.0
1 – 14 3,000 3 1.0 20,000 35 1.0
15 – 34 6,000 6 1.0 35,000 35 1.0
35 – 54 13,000 52 4.0 17,000 85 5.0
55 – 64 7,000 105 15.0 8,000 160 20.0
Over 64 20,000 1,600 80.0 15,000 1,350 90.0
All ages 50,000 1,781 35.6 100,000 1,740 17.4
Standard Population by Age and Age-
Specific Death Rates
8/11/2015
13
Age
(years)
Standard
populatio
n
Death
rate
in A
(per
1,000)
Expected
deaths
at
A’s rate
Death
rate
in B
(per
1,000)
Expected
deaths at
B’s rate
Under 1 6,000 15.0 90 20.0 120.0
1 – 14 23,000 1.0 23 0.5 11.5
15 – 34 41,000 1.0 41 1.0 41.0
35 – 54 30,000 4.0 120 5.0 150.0
55 – 64 15,000 15.0 225 20.0 300.0
Over 64 35,000 80.0 2,800 90.0 3,150
Total 150,000 35,6 3,299 17.4 3,772.5
Age –
adjusted
death
rate (per
1000)
22.0 25.0
Indirect Adjustment of Rates
8/11/2015
14
 Used if age-specific rates cannot be
estimated
 Mirror image of the direct method
Indirect Adjestment Of Rates
8/11/2015
15
 Based on applying the age-specific
rates of the standard population to
the population of interest to
determine the number of “expected”
deaths.
Standardized Mortality ratio
Standardized Mortality Ratio
8/11/2015
16
Total observed deaths
in a population
-----------------------
Total expected deaths
in a population
Standardization Examples
o Direct Method requires
 Age-specific rates in the sample
population
The age of each case
The population-at-risk for each age
group in the sample
 Age structure (percentage of cases in
each age group) of a standard population
8/11/2015
17
Indirect Standardization
 Instead of a standard population
structure, you utilize a standard rate
to adjust your sample
 Indirect standardization does not
require that you know the stratum-
specific rates of your cases
 The summary measure is the SMR or
standardized mortality/morbidity ratio
SMR = Observed X 100
Expected
8/11/2015
18
Standardize Mortality Rate
 Expect a Healthy worker effect
 Occupational studies should have SMRs <
100
 Workers tend to be healthier than the
general population which comprises both
healthy and unhealthy individuals
 You cannot compare SMRs
between studies -- only to
the standard population
8/11/2015
19
Standardization:
Age Adjustment (cont.)
 Indirect method requires
 Age structure of the sample population
at risk
 Total cases in the sample population
(not ages of cases)
 Age-specific rates for a standard
population
8/11/2015
20
Age Standerdization
 Occurrence of disease in one area may
appear to be higher than in another
because:
 population structures are different
 one area is older than another
 Standardisation used to adjust for the
effects of age on mortality rates or
other rates
 Direct or Indirect
 Involves the calculation of numbers of
expected events which are then compared
with numbers of observed events.
8/11/2015
21
Example of London and Camden
8/11/2015
22
The problem…
 The crude rates are not comparable
because the age structure of the
populations are different
 What would the expected number of deaths
be in London and Camden if the age
structures were the identical?
This is DIRECT STANDARDISATION called
DIRECT STANDARDISED RATES
 What would the expected number of deaths
be in London and Camden if the age
specific rates were identical?
This is INDIRECT STANDARDISATION called
STANDARDISED MORTALITY RATIO
8/11/2015
23
Direct standardisation – method
1. Decide which standard population to use –
EUROPEAN STANDARD POPULATION
2. Calculate expected deaths if both London
and Camden had the same population
structure as the European standard.
3. Express as a rate per 1,000 or 100,000
population
8/11/2015
24
Direct standardisation
Example of London and Camden
8/11/2015
25
Interpretation of SMRs
 SMR < 100 : lower rate than expected
 SMR = 100 : Expected/standard rate
 SMR > 100 : higher rate than expected
 An SMR of 180 represents a mortality
rate that is 80% higher than expected.
8/11/2015
26
Standardised mortality ratio 2005-07
8/11/2015
27
Which Method To Use?
 If want to compare several population groups
or several time periods use DIRECT as with
INDIRECT can only compare each population
group to the standard.
 INDIRECT is useful to determine if disease
incidence is high or low in one area only.
 If age specific rates for the population
groups are not available or unreliable use
INDIRECT.
 If it is a rare event and therefore number
of deaths in population groups is small
(e.g. ward level CHD deaths) use INDIRECT.
8/11/2015
28
Issues in the use of standardization
 Standardized rates are used for the
comparison of two or more populations;
they represent a weighted average of
the age specific rates taken from a
'standard population' and are not
actual rates.
 The direct method of standardization
requires that the age-specific rates
for all populations being studied are
available and that a standard
population is defined.
8/11/2015
29
Continued....
 The indirect method of standardization
requires the total number of cases
 The ratio of two directly standardized
rates is called the Comparative
Incidence Ratio or Comparative
Mortality Ratio.
 The ratio of two indirectly
standardized rates is called the
Standardized Incidence Ratio or the
Standardized Mortality Ratio.
8/11/2015
30
Continued....
 Indirect standardization is more
appropriate for use in studies with
small numbers or when the rates are
unstable.
 As the choice of a standard population
will affect the comparison between
populations, it should always be
stated clearly which standard
population has been applied.
8/11/2015
31
Continued....
 Standardization may be used to adjust
for the effects of a variety of
confounding factors including age,
sex, race or socio-economic status.
8/11/2015
32
Pros Cons
 Able to compare
different areas
with each other.
 Can look at
trends through
time.
 (Only if ALL use
the same standard
population)
 Need local data
for all age bands
 Rare diseases may
have no events in
specific age bands
so age specific
rates may be
unavailable
 May need to merge
events from
different years or
combine age bands
Pros and Cons of DSRs
8/11/2015
33
Pros Cons
 Can use where
diseases are rare
 Don’t need local
event information
for all age
groups
 Just need total
number of
observed and
expected counts
 Cannot compare
SMRs with each
other unless
population
structures are
identical
 Cannot look at
trends through
time
Pros and cons of SMRs
8/11/2015
34
Summery
 Standardisation can be use in many areas
 Although we’ve looked at mortality, the
technique can be applied in other ways:
 Hospital admissions
 Prevalence/incidence of disease
 Prescriptions
 Etc
● One type of rate is not necessarily more
important than another. Which you choose
depends on the information sought.
8/11/2015
35
Continued....
 Standardized rates provide a kind of
“snapshot” of the overall risk of
disease or death, which can be
compared across
populations.
 Standardization of rates can be
difficult to understand and is
explained in several different ways
depending on the literature source.
8/11/2015
36
Aknowledgement
 Dr. Minakshi Khapre
 Dr. Abhishek Ingole
 Dr. Pramita Mutonde
 All the PG’S in the department.
8/11/2015
37
References
 1. Heinekens CH, Burring JE. Epidemiology in
Medicine. Lippincott Williams & Wilkins, 1987.
2. Farmer, R. Lawperson, R. 2004. Lecture
notes in Epidemiology and Public Health
Medicine pp 67-68. Blackwell Publishing.
 Text Book of Community Medicine
(Fourth Edition)- By. Dr. Kulkarni, Dr. P.P.
Doke, Dr. J.P Baride, Dr. P.Y. Mulay
 Basic Concept & Methodology for the Health
Sciences (Ninth Edition)- By- Wayan W. Daniel
 Community Medicine with recent Advances-
By- A.H. Suryakantha
 Park’s Text Book of Preventive Social Medicine
(23rd Edition)- By_ Dr. K.Park
8/11/2015
38
Standerdization

Standerdization

  • 1.
    PRESENTED BY: DR. KUNAL GUIDEDBY: DR. ABHAY MUDEY STANDERDIZATION
  • 2.
    What is standardization? The development and application of a standard for a particular measures or type of component or range of measurements or proportions or rates.  The process by which you derive a summary figure to compare health outcomes of groups.  The process can be used for mortality or morbidity data. 8/11/2015 2
  • 3.
    8/11/2015 3  What distinguishesstandardization of rates from other stratified methods of controlling for confounding, is use of an external standard as the basis for comparison.
  • 4.
    Basic Measurement 8/11/2015 4 o Ratio oProportion o Rates- o Case fatality rate o Mortality rates(age specific/cause specific)
  • 5.
    Crude vs. standerdized PREFER REJECT UniformLocalized Adapted Line shows likelihood of correction
  • 6.
    Standardization Of Rates 8/11/2015 6 Used to reduce distortion in comparisons between crude areas  Also referred to as adjusting rates
  • 7.
    Crude rate 8/11/2015 7  Advantages Actual Summary rates  Easy calculation for international comparisons  Disadvantages  Since population vary in composition (e.g., age) differences in crude rates difficult to interpret
  • 8.
    Specific Rate 8/11/2015 8  Advantages Homogenous subgroups  Detailed rates useful for public health and  Epidemiological aims  Disadvantages  Cumbersome to compare subgroups of two or  more populations
  • 9.
    Adjusted Rates 8/11/2015 9  Advantages Summary statement  Differences in group composition “removed”  allows unbiased comparison  Disadvantages  Fictional rates  Absolute magnitude dependent on standard  population chosen  Opposing trends in subgroup masked
  • 10.
    Direct Adjusted Rates 8/11/2015 10 Requires a standard population, to which the estimated age-specific rates can be applied  Choice of the standard population may affect the magnitude of the age-adjusted rates, but not the ranking of the population
  • 11.
    Direct Adjusted rates 8/11/2015 11 Multiply standard population by age- specific rates for populations A and B to determine the standardized rates  Compare standardized rates
  • 12.
    Population, deaths, deathrate by community & by age 8/11/2015 12 Community A Community B Age (year) Population Deaths Death Rate (per 1000) Population Deaths Death Rate (per 1000) Under 1 1,000 15 15.0 5,000 100 20.0 1 – 14 3,000 3 1.0 20,000 35 1.0 15 – 34 6,000 6 1.0 35,000 35 1.0 35 – 54 13,000 52 4.0 17,000 85 5.0 55 – 64 7,000 105 15.0 8,000 160 20.0 Over 64 20,000 1,600 80.0 15,000 1,350 90.0 All ages 50,000 1,781 35.6 100,000 1,740 17.4
  • 13.
    Standard Population byAge and Age- Specific Death Rates 8/11/2015 13 Age (years) Standard populatio n Death rate in A (per 1,000) Expected deaths at A’s rate Death rate in B (per 1,000) Expected deaths at B’s rate Under 1 6,000 15.0 90 20.0 120.0 1 – 14 23,000 1.0 23 0.5 11.5 15 – 34 41,000 1.0 41 1.0 41.0 35 – 54 30,000 4.0 120 5.0 150.0 55 – 64 15,000 15.0 225 20.0 300.0 Over 64 35,000 80.0 2,800 90.0 3,150 Total 150,000 35,6 3,299 17.4 3,772.5 Age – adjusted death rate (per 1000) 22.0 25.0
  • 14.
    Indirect Adjustment ofRates 8/11/2015 14  Used if age-specific rates cannot be estimated  Mirror image of the direct method
  • 15.
    Indirect Adjestment OfRates 8/11/2015 15  Based on applying the age-specific rates of the standard population to the population of interest to determine the number of “expected” deaths. Standardized Mortality ratio
  • 16.
    Standardized Mortality Ratio 8/11/2015 16 Totalobserved deaths in a population ----------------------- Total expected deaths in a population
  • 17.
    Standardization Examples o DirectMethod requires  Age-specific rates in the sample population The age of each case The population-at-risk for each age group in the sample  Age structure (percentage of cases in each age group) of a standard population 8/11/2015 17
  • 18.
    Indirect Standardization  Insteadof a standard population structure, you utilize a standard rate to adjust your sample  Indirect standardization does not require that you know the stratum- specific rates of your cases  The summary measure is the SMR or standardized mortality/morbidity ratio SMR = Observed X 100 Expected 8/11/2015 18
  • 19.
    Standardize Mortality Rate Expect a Healthy worker effect  Occupational studies should have SMRs < 100  Workers tend to be healthier than the general population which comprises both healthy and unhealthy individuals  You cannot compare SMRs between studies -- only to the standard population 8/11/2015 19
  • 20.
    Standardization: Age Adjustment (cont.) Indirect method requires  Age structure of the sample population at risk  Total cases in the sample population (not ages of cases)  Age-specific rates for a standard population 8/11/2015 20
  • 21.
    Age Standerdization  Occurrenceof disease in one area may appear to be higher than in another because:  population structures are different  one area is older than another  Standardisation used to adjust for the effects of age on mortality rates or other rates  Direct or Indirect  Involves the calculation of numbers of expected events which are then compared with numbers of observed events. 8/11/2015 21
  • 22.
    Example of Londonand Camden 8/11/2015 22
  • 23.
    The problem…  Thecrude rates are not comparable because the age structure of the populations are different  What would the expected number of deaths be in London and Camden if the age structures were the identical? This is DIRECT STANDARDISATION called DIRECT STANDARDISED RATES  What would the expected number of deaths be in London and Camden if the age specific rates were identical? This is INDIRECT STANDARDISATION called STANDARDISED MORTALITY RATIO 8/11/2015 23
  • 24.
    Direct standardisation –method 1. Decide which standard population to use – EUROPEAN STANDARD POPULATION 2. Calculate expected deaths if both London and Camden had the same population structure as the European standard. 3. Express as a rate per 1,000 or 100,000 population 8/11/2015 24
  • 25.
    Direct standardisation Example ofLondon and Camden 8/11/2015 25
  • 26.
    Interpretation of SMRs SMR < 100 : lower rate than expected  SMR = 100 : Expected/standard rate  SMR > 100 : higher rate than expected  An SMR of 180 represents a mortality rate that is 80% higher than expected. 8/11/2015 26
  • 27.
    Standardised mortality ratio2005-07 8/11/2015 27
  • 28.
    Which Method ToUse?  If want to compare several population groups or several time periods use DIRECT as with INDIRECT can only compare each population group to the standard.  INDIRECT is useful to determine if disease incidence is high or low in one area only.  If age specific rates for the population groups are not available or unreliable use INDIRECT.  If it is a rare event and therefore number of deaths in population groups is small (e.g. ward level CHD deaths) use INDIRECT. 8/11/2015 28
  • 29.
    Issues in theuse of standardization  Standardized rates are used for the comparison of two or more populations; they represent a weighted average of the age specific rates taken from a 'standard population' and are not actual rates.  The direct method of standardization requires that the age-specific rates for all populations being studied are available and that a standard population is defined. 8/11/2015 29
  • 30.
    Continued....  The indirectmethod of standardization requires the total number of cases  The ratio of two directly standardized rates is called the Comparative Incidence Ratio or Comparative Mortality Ratio.  The ratio of two indirectly standardized rates is called the Standardized Incidence Ratio or the Standardized Mortality Ratio. 8/11/2015 30
  • 31.
    Continued....  Indirect standardizationis more appropriate for use in studies with small numbers or when the rates are unstable.  As the choice of a standard population will affect the comparison between populations, it should always be stated clearly which standard population has been applied. 8/11/2015 31
  • 32.
    Continued....  Standardization maybe used to adjust for the effects of a variety of confounding factors including age, sex, race or socio-economic status. 8/11/2015 32
  • 33.
    Pros Cons  Ableto compare different areas with each other.  Can look at trends through time.  (Only if ALL use the same standard population)  Need local data for all age bands  Rare diseases may have no events in specific age bands so age specific rates may be unavailable  May need to merge events from different years or combine age bands Pros and Cons of DSRs 8/11/2015 33
  • 34.
    Pros Cons  Canuse where diseases are rare  Don’t need local event information for all age groups  Just need total number of observed and expected counts  Cannot compare SMRs with each other unless population structures are identical  Cannot look at trends through time Pros and cons of SMRs 8/11/2015 34
  • 35.
    Summery  Standardisation canbe use in many areas  Although we’ve looked at mortality, the technique can be applied in other ways:  Hospital admissions  Prevalence/incidence of disease  Prescriptions  Etc ● One type of rate is not necessarily more important than another. Which you choose depends on the information sought. 8/11/2015 35
  • 36.
    Continued....  Standardized ratesprovide a kind of “snapshot” of the overall risk of disease or death, which can be compared across populations.  Standardization of rates can be difficult to understand and is explained in several different ways depending on the literature source. 8/11/2015 36
  • 37.
    Aknowledgement  Dr. MinakshiKhapre  Dr. Abhishek Ingole  Dr. Pramita Mutonde  All the PG’S in the department. 8/11/2015 37
  • 38.
    References  1. HeinekensCH, Burring JE. Epidemiology in Medicine. Lippincott Williams & Wilkins, 1987. 2. Farmer, R. Lawperson, R. 2004. Lecture notes in Epidemiology and Public Health Medicine pp 67-68. Blackwell Publishing.  Text Book of Community Medicine (Fourth Edition)- By. Dr. Kulkarni, Dr. P.P. Doke, Dr. J.P Baride, Dr. P.Y. Mulay  Basic Concept & Methodology for the Health Sciences (Ninth Edition)- By- Wayan W. Daniel  Community Medicine with recent Advances- By- A.H. Suryakantha  Park’s Text Book of Preventive Social Medicine (23rd Edition)- By_ Dr. K.Park 8/11/2015 38