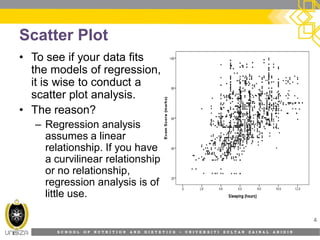
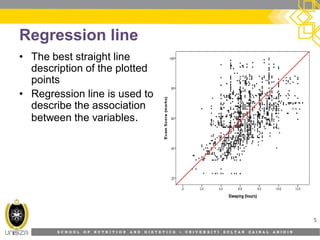
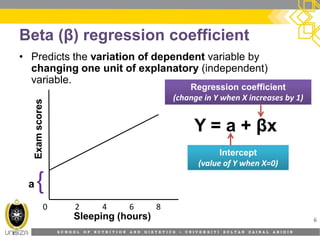
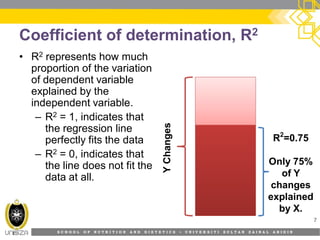
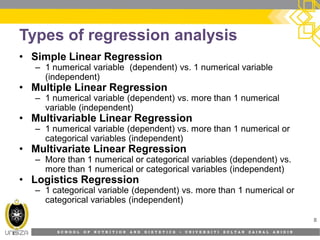
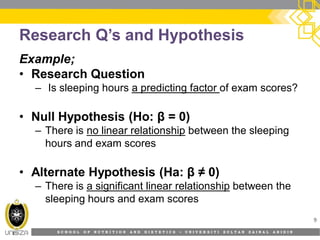
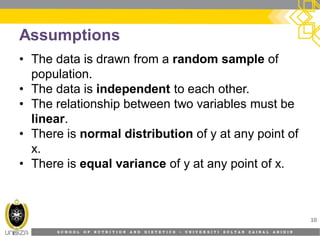
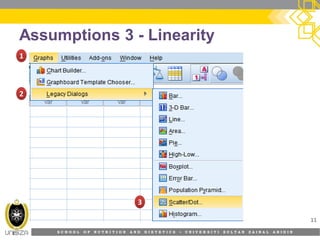
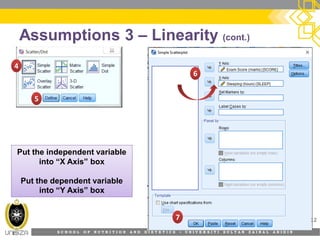
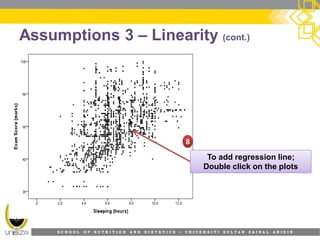
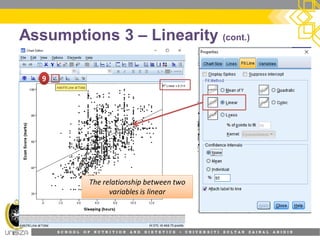
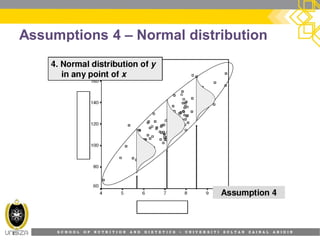
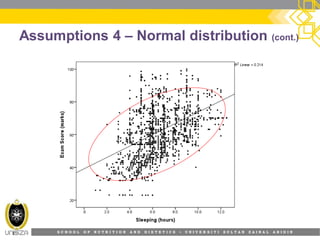
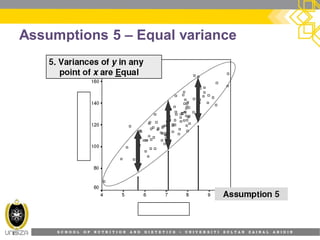
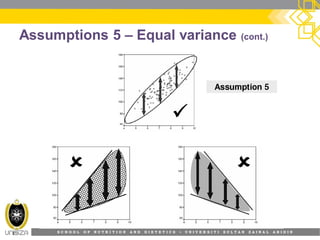
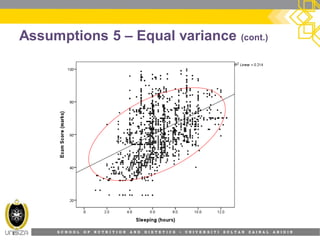
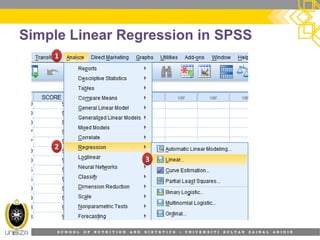
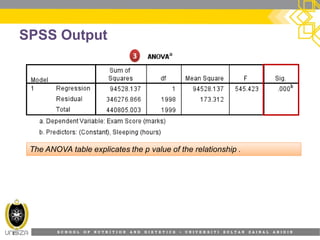
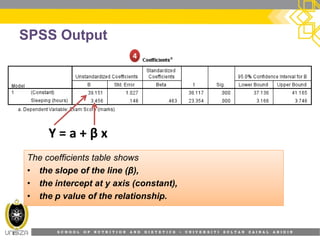
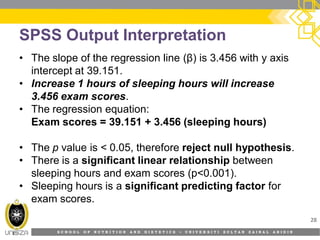
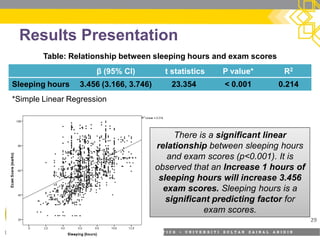
SlideShare a Scribd company logo
KNOWLEDGE FOR THE BENEFIT OF HUMANITYKNOWLEDGE FOR THE BENEFIT OF HUMANITY
BIOSTATISTICS (HFS3283)
REGRESSION
Dr.Dr. MohdMohd RazifRazif ShahrilShahril
School of Nutrition & DieteticsSchool of Nutrition & Dietetics
Faculty of Health SciencesFaculty of Health Sciences
UniversitiUniversiti SultanSultan ZainalZainal AbidinAbidin
1
S C H O O L O F N U T R I T I O N A N D D I E T E T I C S • U N I V E R S I T I S U L T A N Z A I N A L A B I D I N
Topic Learning Outcomes
At the end of this lecture, students should be able to;
• identify types of regression analysis and their use.
• explain assumptions to be met when using Simple Linear
Regression.
• perform Simple Linear Regression analysis using SPSS.
• explain how to interpret the SPSS outputs from Simple
Linear Regression analysis.
2
S C H O O L O F N U T R I T I O N A N D D I E T E T I C S • U N I V E R S I T I S U L T A N Z A I N A L A B I D I N
Regression
• Regression analysis is the estimation of linear
relationship between a dependent variable and one or
more independent variables or covariates
• Regression is used to predict the value of the dependent
variable when value of independent variable(s) known
• Does not imply causality
• Regression analysis requires interval and ratio-level
data.
3
S C H O O L O F N U T R I T I O N A N D D I E T E T I C S • U N I V E R S I T I S U L T A N Z A I N A L A B I D I N
Scatter Plot
• To see if your data fits
the models of regression,
it is wise to conduct a
scatter plot analysis.
• The reason?
– Regression analysis
assumes a linear
relationship. If you have
a curvilinear relationship
or no relationship,
regression analysis is of
little use.
4
S C H O O L O F N U T R I T I O N A N D D I E T E T I C S • U N I V E R S I T I S U L T A N Z A I N A L A B I D I N
Regression line
• The best straight line
description of the plotted
points
• Regression line is used to
describe the association
between the variables.
5
S C H O O L O F N U T R I T I O N A N D D I E T E T I C S • U N I V E R S I T I S U L T A N Z A I N A L A B I D I N
Beta (β) regression coefficient
• Predicts the variation of dependent variable by
changing one unit of explanatory (independent)
variable.
6Sleeping (hours)
Examscores
0 2 4 6 8
Y = a + βx
Regression coefficientRegression coefficient
(change in Y when X increases by 1)
InterceptIntercept
(value of Y when X=0)
a{
S C H O O L O F N U T R I T I O N A N D D I E T E T I C S • U N I V E R S I T I S U L T A N Z A I N A L A B I D I N
Coefficient of determination, R2
• R2 represents how much
proportion of the variation
of dependent variable
explained by the
independent variable.
– R2 = 1, indicates that
the regression line
perfectly fits the data
– R2 = 0, indicates that
the line does not fit the
data at all.
7
R2
=0.75
Only 75%
of Y
changes
explained
by X.
YChanges
S C H O O L O F N U T R I T I O N A N D D I E T E T I C S • U N I V E R S I T I S U L T A N Z A I N A L A B I D I N
Types of regression analysis
• Simple Linear Regression
– 1 numerical variable (dependent) vs. 1 numerical variable
(independent)
• Multiple Linear Regression
– 1 numerical variable (dependent) vs. more than 1 numerical
variable (independent)
• Multivariable Linear Regression
– 1 numerical variable (dependent) vs. more than 1 numerical or
categorical variables (independent)
• Multivariate Linear Regression
– More than 1 numerical or categorical variables (dependent) vs.
more than 1 numerical or categorical variables (independent)
• Logistics Regression
– 1 categorical variable (dependent) vs. more than 1 numerical or
categorical variables (independent)
8
S C H O O L O F N U T R I T I O N A N D D I E T E T I C S • U N I V E R S I T I S U L T A N Z A I N A L A B I D I N
Research Q’s and Hypothesis
Example;
• Research Question
– Is sleeping hours a predicting factor of exam scores?
• Null Hypothesis (Ho: β = 0)
– There is no linear relationship between the sleeping
hours and exam scores
• Alternate Hypothesis (Ha: β ≠ 0)
– There is a significant linear relationship between the
sleeping hours and exam scores
9
S C H O O L O F N U T R I T I O N A N D D I E T E T I C S • U N I V E R S I T I S U L T A N Z A I N A L A B I D I N
Assumptions
• The data is drawn from a random sample of
population.
• The data is independent to each other.
• The relationship between two variables must be
linear.
• There is normal distribution of y at any point of
x.
• There is equal variance of y at any point of x.
10
S C H O O L O F N U T R I T I O N A N D D I E T E T I C S • U N I V E R S I T I S U L T A N Z A I N A L A B I D I N
Assumptions 3 - Linearity
11
11
22
33
S C H O O L O F N U T R I T I O N A N D D I E T E T I C S • U N I V E R S I T I S U L T A N Z A I N A L A B I D I N
Assumptions 3 – Linearity (cont.)
12
44
55
66
77
Put the independent variablePut the independent variable
into “X Axis” box
Put the dependent variable
into “Y Axis” box
S C H O O L O F N U T R I T I O N A N D D I E T E T I C S • U N I V E R S I T I S U L T A N Z A I N A L A B I D I N
Assumptions 3 – Linearity (cont.)
To add regression line;To add regression line;
Double click on the plots
88
S C H O O L O F N U T R I T I O N A N D D I E T E T I C S • U N I V E R S I T I S U L T A N Z A I N A L A B I D I N
Assumptions 3 – Linearity (cont.)
99
The relationship between twoThe relationship between two
variables is linear
S C H O O L O F N U T R I T I O N A N D D I E T E T I C S • U N I V E R S I T I S U L T A N Z A I N A L A B I D I N
Assumptions 4 – Normal distribution
S C H O O L O F N U T R I T I O N A N D D I E T E T I C S • U N I V E R S I T I S U L T A N Z A I N A L A B I D I N
Assumptions 4 – Normal distribution (cont.)
S C H O O L O F N U T R I T I O N A N D D I E T E T I C S • U N I V E R S I T I S U L T A N Z A I N A L A B I D I N
Assumptions 5 – Equal variance
S C H O O L O F N U T R I T I O N A N D D I E T E T I C S • U N I V E R S I T I S U L T A N Z A I N A L A B I D I N
Assumptions 5 – Equal variance (cont.)
S C H O O L O F N U T R I T I O N A N D D I E T E T I C S • U N I V E R S I T I S U L T A N Z A I N A L A B I D I N
Assumptions 5 – Equal variance (cont.)
S C H O O L O F N U T R I T I O N A N D D I E T E T I C S • U N I V E R S I T I S U L T A N Z A I N A L A B I D I N
Simple Linear Regression in SPSS
11
22
33
S C H O O L O F N U T R I T I O N A N D D I E T E T I C S • U N I V E R S I T I S U L T A N Z A I N A L A B I D I N
Simple Linear Regression in SPSS
44
55
Put the independent variablePut the independent variable
into “X Axis” box
Put the dependent variable
into “Y Axis” box
S C H O O L O F N U T R I T I O N A N D D I E T E T I C S • U N I V E R S I T I S U L T A N Z A I N A L A B I D I N
Simple Linear Regression in SPSS
66
88
77
S C H O O L O F N U T R I T I O N A N D D I E T E T I C S • U N I V E R S I T I S U L T A N Z A I N A L A B I D I N
Simple Linear Regression in SPSS
99
S C H O O L O F N U T R I T I O N A N D D I E T E T I C S • U N I V E R S I T I S U L T A N Z A I N A L A B I D I N
SPSS Output
11
• The table demonstrates the method used in this data analysis.
•
• The table demonstrates the method used in this data analysis.
• No variable selection was carried out.
S C H O O L O F N U T R I T I O N A N D D I E T E T I C S • U N I V E R S I T I S U L T A N Z A I N A L A B I D I N
SPSS Output
22
The ‘Model Summary’ table shows the
•
•
•
•
•
The ‘Model Summary’ table shows the
• Correlation coefficient (R)
• Coefficient of determination (R2)
• The correlation coefficient (r) is 0.463 and thus there is fair
positive linear relationship between the two variable.
• The coefficient of determination (r2) is 0.214.
• Thus 21.4% of variation of exam scores is explained by sleeping
hours.
S C H O O L O F N U T R I T I O N A N D D I E T E T I C S • U N I V E R S I T I S U L T A N Z A I N A L A B I D I N
SPSS Output
33
The ANOVA table explicates the p value of the relationship .The ANOVA table explicates the p value of the relationship .
S C H O O L O F N U T R I T I O N A N D D I E T E T I C S • U N I V E R S I T I S U L T A N Z A I N A L A B I D I N
SPSS Output
44
The coefficients table shows
•
•
•
The coefficients table shows
• the slope of the line (β),
• the intercept at y axis (constant),
• the p value of the relationship.
Y = a + β x
S C H O O L O F N U T R I T I O N A N D D I E T E T I C S • U N I V E R S I T I S U L T A N Z A I N A L A B I D I N
SPSS Output Interpretation
• The slope of the regression line (β) is 3.456 with y axis
intercept at 39.151.
• Increase 1 hours of sleeping hours will increase
3.456 exam scores.
• The regression equation:
Exam scores = 39.151 + 3.456 (sleeping hours)
• The p value is < 0.05, therefore reject null hypothesis.
• There is a significant linear relationship between
sleeping hours and exam scores (p<0.001).
• Sleeping hours is a significant predicting factor for
exam scores.
28
S C H O O L O F N U T R I T I O N A N D D I E T E T I C S • U N I V E R S I T I S U L T A N Z A I N A L A B I D I N
Results Presentation
29
β (95% CI) t statistics P value* R2
Sleeping hours 3.456 (3.166, 3.746) 23.354 < 0.001 0.214
Table: Relationship between sleeping hours and exam scores
*Simple Linear Regression
There is a significant linear
between sleeping hours
observed that an of
There is a significant linear
relationship between sleeping hours
and exam scores (p<0.001). It is
observed that an Increase 1 hours of
sleeping hours will increase 3.456
exam scores. Sleeping hours is a
significant predicting factor for
exam scores.
Thank YouThank You
30

More Related Content

What's hot

Logistic regression
Logistic regressionLogistic regression
Logistic regression
DrZahid Khan
 
Correlation and regression
Correlation and regressionCorrelation and regression
Correlation and regressionKhalid Aziz
 
Correlation
CorrelationCorrelation
CorrelationTech_MX
 
Multivariate analysis - Multiple regression analysis
Multivariate analysis -  Multiple regression analysisMultivariate analysis -  Multiple regression analysis
Multivariate analysis - Multiple regression analysis
RaihanathusSahdhiyya
 
8. Correlation
8. Correlation8. Correlation
8. Correlation
Razif Shahril
 
Logistic regression
Logistic regressionLogistic regression
Logistic regression
DrZahid Khan
 
Correlation
CorrelationCorrelation
Correlation
James Neill
 
Confidence interval
Confidence intervalConfidence interval
Confidence interval
Shakeel Nouman
 
Simple linear regression
Simple linear regressionSimple linear regression
Simple linear regression
pankaj8108
 
Logistic Regression Analysis
Logistic Regression AnalysisLogistic Regression Analysis
Logistic Regression Analysis
COSTARCH Analytical Consulting (P) Ltd.
 
Simple linear regression
Simple linear regressionSimple linear regression
Simple linear regression
Avjinder (Avi) Kaler
 
Correlation and regression
Correlation and regressionCorrelation and regression
Correlation and regression
Ajendra7846
 
Regression
RegressionRegression
Regression
LavanyaK75
 
Correlation and regression
Correlation and regressionCorrelation and regression
Correlation and regression
Abdelaziz Tayoun
 
Multiple linear regression
Multiple linear regressionMultiple linear regression
Multiple linear regression
Avjinder (Avi) Kaler
 
Simple linear regression
Simple linear regressionSimple linear regression
Simple linear regression
RekhaChoudhary24
 
Correlation analysis notes
Correlation analysis notesCorrelation analysis notes
Correlation analysis notes
Japheth Muthama
 
Regression analysis
Regression analysisRegression analysis
Regression analysisRavi shankar
 
Correlation
CorrelationCorrelation
Correlation
joshuarodrick
 

What's hot (20)

Logistic regression
Logistic regressionLogistic regression
Logistic regression
 
Correlation and regression
Correlation and regressionCorrelation and regression
Correlation and regression
 
Correlation
CorrelationCorrelation
Correlation
 
Multivariate analysis - Multiple regression analysis
Multivariate analysis -  Multiple regression analysisMultivariate analysis -  Multiple regression analysis
Multivariate analysis - Multiple regression analysis
 
8. Correlation
8. Correlation8. Correlation
8. Correlation
 
Logistic regression
Logistic regressionLogistic regression
Logistic regression
 
Correlation
CorrelationCorrelation
Correlation
 
Confidence interval
Confidence intervalConfidence interval
Confidence interval
 
Simple linear regression
Simple linear regressionSimple linear regression
Simple linear regression
 
Logistic Regression Analysis
Logistic Regression AnalysisLogistic Regression Analysis
Logistic Regression Analysis
 
Simple linear regression
Simple linear regressionSimple linear regression
Simple linear regression
 
Correlation and regression
Correlation and regressionCorrelation and regression
Correlation and regression
 
Regression
RegressionRegression
Regression
 
Correlation and regression
Correlation and regressionCorrelation and regression
Correlation and regression
 
Multiple linear regression
Multiple linear regressionMultiple linear regression
Multiple linear regression
 
Simple linear regression
Simple linear regressionSimple linear regression
Simple linear regression
 
Correlation analysis notes
Correlation analysis notesCorrelation analysis notes
Correlation analysis notes
 
Regression analysis
Regression analysisRegression analysis
Regression analysis
 
Correlation
CorrelationCorrelation
Correlation
 
Correlation and Simple Regression
Correlation  and Simple RegressionCorrelation  and Simple Regression
Correlation and Simple Regression
 

Similar to 9. Regression

5. Non parametric analysis
5. Non parametric analysis5. Non parametric analysis
5. Non parametric analysis
Razif Shahril
 
2. Inferential statistics
2. Inferential statistics2. Inferential statistics
2. Inferential statistics
Razif Shahril
 
11. Processing and displaying data
11. Processing and displaying data11. Processing and displaying data
11. Processing and displaying data
Razif Shahril
 
C6-CHI-SQUARE-OF-INDEPENDENCE.pdf
C6-CHI-SQUARE-OF-INDEPENDENCE.pdfC6-CHI-SQUARE-OF-INDEPENDENCE.pdf
C6-CHI-SQUARE-OF-INDEPENDENCE.pdf
EveGraceAlisbo
 
Introduction to Statistical Methods
Introduction to Statistical MethodsIntroduction to Statistical Methods
Introduction to Statistical Methods
Michael770443
 
5. Identifying variables and constructing hypothesis
5. Identifying variables and constructing hypothesis5. Identifying variables and constructing hypothesis
5. Identifying variables and constructing hypothesis
Razif Shahril
 
Research methodology and iostatistics ppt
Research methodology and iostatistics pptResearch methodology and iostatistics ppt
Research methodology and iostatistics ppt
Nikhat Mohammadi
 
Shreyansh (17526001)
Shreyansh (17526001)Shreyansh (17526001)
Shreyansh (17526001)
Ramboll India Pvt Ltd
 
Normal distribution
Normal distributionNormal distribution
Normal distribution
CamilleJoy3
 
Linear Regression
Linear RegressionLinear Regression
Linear Regression
Michael770443
 
RESEARCH METHODOLOGY - 2nd year ppt
RESEARCH METHODOLOGY - 2nd year pptRESEARCH METHODOLOGY - 2nd year ppt
RESEARCH METHODOLOGY - 2nd year ppt
Aayushi Chhabra
 
6. Categorical data analysis - Chi-Square & Fisher Exact Test
6. Categorical data analysis - Chi-Square & Fisher Exact Test6. Categorical data analysis - Chi-Square & Fisher Exact Test
6. Categorical data analysis - Chi-Square & Fisher Exact Test
Razif Shahril
 
Classification
ClassificationClassification
Classification
Michael770443
 
The-Normal-Distribution, Statics and Pro
The-Normal-Distribution, Statics and ProThe-Normal-Distribution, Statics and Pro
The-Normal-Distribution, Statics and Pro
GiancarloMercado2
 
Lecture 4
Lecture 4Lecture 4
2.0.statistical methods and determination of sample size
2.0.statistical methods and determination of sample size2.0.statistical methods and determination of sample size
2.0.statistical methods and determination of sample size
salummkata1
 
슬로우캠퍼스: scikit-learn & 머신러닝 (강박사)
슬로우캠퍼스:  scikit-learn & 머신러닝 (강박사)슬로우캠퍼스:  scikit-learn & 머신러닝 (강박사)
슬로우캠퍼스: scikit-learn & 머신러닝 (강박사)
마이캠퍼스
 
ChandanChakrabarty_1.pdf
ChandanChakrabarty_1.pdfChandanChakrabarty_1.pdf
ChandanChakrabarty_1.pdf
Dikshathawait
 
Chapter34
Chapter34Chapter34
Chapter34
Ying Liu
 
Lec1.regression
Lec1.regressionLec1.regression
Lec1.regression
Aftab Alam
 

Similar to 9. Regression (20)

5. Non parametric analysis
5. Non parametric analysis5. Non parametric analysis
5. Non parametric analysis
 
2. Inferential statistics
2. Inferential statistics2. Inferential statistics
2. Inferential statistics
 
11. Processing and displaying data
11. Processing and displaying data11. Processing and displaying data
11. Processing and displaying data
 
C6-CHI-SQUARE-OF-INDEPENDENCE.pdf
C6-CHI-SQUARE-OF-INDEPENDENCE.pdfC6-CHI-SQUARE-OF-INDEPENDENCE.pdf
C6-CHI-SQUARE-OF-INDEPENDENCE.pdf
 
Introduction to Statistical Methods
Introduction to Statistical MethodsIntroduction to Statistical Methods
Introduction to Statistical Methods
 
5. Identifying variables and constructing hypothesis
5. Identifying variables and constructing hypothesis5. Identifying variables and constructing hypothesis
5. Identifying variables and constructing hypothesis
 
Research methodology and iostatistics ppt
Research methodology and iostatistics pptResearch methodology and iostatistics ppt
Research methodology and iostatistics ppt
 
Shreyansh (17526001)
Shreyansh (17526001)Shreyansh (17526001)
Shreyansh (17526001)
 
Normal distribution
Normal distributionNormal distribution
Normal distribution
 
Linear Regression
Linear RegressionLinear Regression
Linear Regression
 
RESEARCH METHODOLOGY - 2nd year ppt
RESEARCH METHODOLOGY - 2nd year pptRESEARCH METHODOLOGY - 2nd year ppt
RESEARCH METHODOLOGY - 2nd year ppt
 
6. Categorical data analysis - Chi-Square & Fisher Exact Test
6. Categorical data analysis - Chi-Square & Fisher Exact Test6. Categorical data analysis - Chi-Square & Fisher Exact Test
6. Categorical data analysis - Chi-Square & Fisher Exact Test
 
Classification
ClassificationClassification
Classification
 
The-Normal-Distribution, Statics and Pro
The-Normal-Distribution, Statics and ProThe-Normal-Distribution, Statics and Pro
The-Normal-Distribution, Statics and Pro
 
Lecture 4
Lecture 4Lecture 4
Lecture 4
 
2.0.statistical methods and determination of sample size
2.0.statistical methods and determination of sample size2.0.statistical methods and determination of sample size
2.0.statistical methods and determination of sample size
 
슬로우캠퍼스: scikit-learn & 머신러닝 (강박사)
슬로우캠퍼스:  scikit-learn & 머신러닝 (강박사)슬로우캠퍼스:  scikit-learn & 머신러닝 (강박사)
슬로우캠퍼스: scikit-learn & 머신러닝 (강박사)
 
ChandanChakrabarty_1.pdf
ChandanChakrabarty_1.pdfChandanChakrabarty_1.pdf
ChandanChakrabarty_1.pdf
 
Chapter34
Chapter34Chapter34
Chapter34
 
Lec1.regression
Lec1.regressionLec1.regression
Lec1.regression
 

More from Razif Shahril

1. Introduction to biostatistics
1. Introduction to biostatistics1. Introduction to biostatistics
1. Introduction to biostatistics
Razif Shahril
 
10. Ethical issues
10. Ethical issues10. Ethical issues
10. Ethical issues
Razif Shahril
 
9. Selecting a sample
9. Selecting a sample9. Selecting a sample
9. Selecting a sample
Razif Shahril
 
8. validity and reliability of research instruments
8. validity and reliability of research instruments8. validity and reliability of research instruments
8. validity and reliability of research instruments
Razif Shahril
 
8. Preparing the report
8. Preparing the report8. Preparing the report
8. Preparing the report
Razif Shahril
 
7. Selecting a data collection method
7. Selecting a data collection method7. Selecting a data collection method
7. Selecting a data collection method
Razif Shahril
 
6. Selecting a study design
6. Selecting a study design6. Selecting a study design
6. Selecting a study design
Razif Shahril
 
4. Formulating research problems
4. Formulating research problems4. Formulating research problems
4. Formulating research problems
Razif Shahril
 
3. Reviewing the literature
3. Reviewing the literature3. Reviewing the literature
3. Reviewing the literature
Razif Shahril
 
1. Prelude + Introduction to Research Methodology
1. Prelude +  Introduction to Research Methodology1. Prelude +  Introduction to Research Methodology
1. Prelude + Introduction to Research Methodology
Razif Shahril
 
5. Case control
5. Case control5. Case control
5. Case control
Razif Shahril
 
6. Randomised controlled trial
6. Randomised controlled trial6. Randomised controlled trial
6. Randomised controlled trial
Razif Shahril
 
4. Cohort
4. Cohort4. Cohort
4. Cohort
Razif Shahril
 
3. Cross sectional
3. Cross sectional3. Cross sectional
3. Cross sectional
Razif Shahril
 
2. Case study and case series
2. Case study and case series2. Case study and case series
2. Case study and case series
Razif Shahril
 
1. Introduction to epidemiological study designs
1. Introduction to epidemiological study designs1. Introduction to epidemiological study designs
1. Introduction to epidemiological study designs
Razif Shahril
 
Scientific writing
Scientific writingScientific writing
Scientific writing
Razif Shahril
 
6. Glycemic index
6. Glycemic index6. Glycemic index
6. Glycemic index
Razif Shahril
 
5. Nutrition in emergencies
5. Nutrition in emergencies5. Nutrition in emergencies
5. Nutrition in emergencies
Razif Shahril
 
4. World Hunger
4. World Hunger4. World Hunger
4. World Hunger
Razif Shahril
 

More from Razif Shahril (20)

1. Introduction to biostatistics
1. Introduction to biostatistics1. Introduction to biostatistics
1. Introduction to biostatistics
 
10. Ethical issues
10. Ethical issues10. Ethical issues
10. Ethical issues
 
9. Selecting a sample
9. Selecting a sample9. Selecting a sample
9. Selecting a sample
 
8. validity and reliability of research instruments
8. validity and reliability of research instruments8. validity and reliability of research instruments
8. validity and reliability of research instruments
 
8. Preparing the report
8. Preparing the report8. Preparing the report
8. Preparing the report
 
7. Selecting a data collection method
7. Selecting a data collection method7. Selecting a data collection method
7. Selecting a data collection method
 
6. Selecting a study design
6. Selecting a study design6. Selecting a study design
6. Selecting a study design
 
4. Formulating research problems
4. Formulating research problems4. Formulating research problems
4. Formulating research problems
 
3. Reviewing the literature
3. Reviewing the literature3. Reviewing the literature
3. Reviewing the literature
 
1. Prelude + Introduction to Research Methodology
1. Prelude +  Introduction to Research Methodology1. Prelude +  Introduction to Research Methodology
1. Prelude + Introduction to Research Methodology
 
5. Case control
5. Case control5. Case control
5. Case control
 
6. Randomised controlled trial
6. Randomised controlled trial6. Randomised controlled trial
6. Randomised controlled trial
 
4. Cohort
4. Cohort4. Cohort
4. Cohort
 
3. Cross sectional
3. Cross sectional3. Cross sectional
3. Cross sectional
 
2. Case study and case series
2. Case study and case series2. Case study and case series
2. Case study and case series
 
1. Introduction to epidemiological study designs
1. Introduction to epidemiological study designs1. Introduction to epidemiological study designs
1. Introduction to epidemiological study designs
 
Scientific writing
Scientific writingScientific writing
Scientific writing
 
6. Glycemic index
6. Glycemic index6. Glycemic index
6. Glycemic index
 
5. Nutrition in emergencies
5. Nutrition in emergencies5. Nutrition in emergencies
5. Nutrition in emergencies
 
4. World Hunger
4. World Hunger4. World Hunger
4. World Hunger
 

Recently uploaded

KDIGO 2024 guidelines for diabetologists
KDIGO 2024 guidelines for diabetologistsKDIGO 2024 guidelines for diabetologists
KDIGO 2024 guidelines for diabetologists
د.محمود نجيب
 
Maxilla, Mandible & Hyoid Bone & Clinical Correlations by Dr. RIG.pptx
Maxilla, Mandible & Hyoid Bone & Clinical Correlations by Dr. RIG.pptxMaxilla, Mandible & Hyoid Bone & Clinical Correlations by Dr. RIG.pptx
Maxilla, Mandible & Hyoid Bone & Clinical Correlations by Dr. RIG.pptx
Dr. Rabia Inam Gandapore
 
New Drug Discovery and Development .....
New Drug Discovery and Development .....New Drug Discovery and Development .....
New Drug Discovery and Development .....
NEHA GUPTA
 
Cervical & Brachial Plexus By Dr. RIG.pptx
Cervical & Brachial Plexus By Dr. RIG.pptxCervical & Brachial Plexus By Dr. RIG.pptx
Cervical & Brachial Plexus By Dr. RIG.pptx
Dr. Rabia Inam Gandapore
 
Hemodialysis: Chapter 3, Dialysis Water Unit - Dr.Gawad
Hemodialysis: Chapter 3, Dialysis Water Unit - Dr.GawadHemodialysis: Chapter 3, Dialysis Water Unit - Dr.Gawad
Hemodialysis: Chapter 3, Dialysis Water Unit - Dr.Gawad
NephroTube - Dr.Gawad
 
Knee anatomy and clinical tests 2024.pdf
Knee anatomy and clinical tests 2024.pdfKnee anatomy and clinical tests 2024.pdf
Knee anatomy and clinical tests 2024.pdf
vimalpl1234
 
Tom Selleck Health: A Comprehensive Look at the Iconic Actor’s Wellness Journey
Tom Selleck Health: A Comprehensive Look at the Iconic Actor’s Wellness JourneyTom Selleck Health: A Comprehensive Look at the Iconic Actor’s Wellness Journey
Tom Selleck Health: A Comprehensive Look at the Iconic Actor’s Wellness Journey
greendigital
 
ANATOMY AND PHYSIOLOGY OF URINARY SYSTEM.pptx
ANATOMY AND PHYSIOLOGY OF URINARY SYSTEM.pptxANATOMY AND PHYSIOLOGY OF URINARY SYSTEM.pptx
ANATOMY AND PHYSIOLOGY OF URINARY SYSTEM.pptx
Swetaba Besh
 
Pharynx and Clinical Correlations BY Dr.Rabia Inam Gandapore.pptx
Pharynx and Clinical Correlations BY Dr.Rabia Inam Gandapore.pptxPharynx and Clinical Correlations BY Dr.Rabia Inam Gandapore.pptx
Pharynx and Clinical Correlations BY Dr.Rabia Inam Gandapore.pptx
Dr. Rabia Inam Gandapore
 
micro teaching on communication m.sc nursing.pdf
micro teaching on communication m.sc nursing.pdfmicro teaching on communication m.sc nursing.pdf
micro teaching on communication m.sc nursing.pdf
Anurag Sharma
 
How to Give Better Lectures: Some Tips for Doctors
How to Give Better Lectures: Some Tips for DoctorsHow to Give Better Lectures: Some Tips for Doctors
How to Give Better Lectures: Some Tips for Doctors
LanceCatedral
 
Triangles of Neck and Clinical Correlation by Dr. RIG.pptx
Triangles of Neck and Clinical Correlation by Dr. RIG.pptxTriangles of Neck and Clinical Correlation by Dr. RIG.pptx
Triangles of Neck and Clinical Correlation by Dr. RIG.pptx
Dr. Rabia Inam Gandapore
 
ARTHROLOGY PPT NCISM SYLLABUS AYURVEDA STUDENTS
ARTHROLOGY PPT NCISM SYLLABUS AYURVEDA STUDENTSARTHROLOGY PPT NCISM SYLLABUS AYURVEDA STUDENTS
ARTHROLOGY PPT NCISM SYLLABUS AYURVEDA STUDENTS
Dr. Vinay Pareek
 
Pictures of Superficial & Deep Fascia.ppt.pdf
Pictures of Superficial & Deep Fascia.ppt.pdfPictures of Superficial & Deep Fascia.ppt.pdf
Pictures of Superficial & Deep Fascia.ppt.pdf
Dr. Rabia Inam Gandapore
 
Light House Retreats: Plant Medicine Retreat Europe
Light House Retreats: Plant Medicine Retreat EuropeLight House Retreats: Plant Medicine Retreat Europe
Light House Retreats: Plant Medicine Retreat Europe
Lighthouse Retreat
 
Flu Vaccine Alert in Bangalore Karnataka
Flu Vaccine Alert in Bangalore KarnatakaFlu Vaccine Alert in Bangalore Karnataka
Flu Vaccine Alert in Bangalore Karnataka
addon Scans
 
Top 10 Best Ayurvedic Kidney Stone Syrups in India
Top 10 Best Ayurvedic Kidney Stone Syrups in IndiaTop 10 Best Ayurvedic Kidney Stone Syrups in India
Top 10 Best Ayurvedic Kidney Stone Syrups in India
SwastikAyurveda
 
263778731218 Abortion Clinic /Pills In Harare ,
263778731218 Abortion Clinic /Pills In Harare ,263778731218 Abortion Clinic /Pills In Harare ,
263778731218 Abortion Clinic /Pills In Harare ,
sisternakatoto
 
Non-respiratory Functions of the Lungs.pdf
Non-respiratory Functions of the Lungs.pdfNon-respiratory Functions of the Lungs.pdf
Non-respiratory Functions of the Lungs.pdf
MedicoseAcademics
 
Are There Any Natural Remedies To Treat Syphilis.pdf
Are There Any Natural Remedies To Treat Syphilis.pdfAre There Any Natural Remedies To Treat Syphilis.pdf
Are There Any Natural Remedies To Treat Syphilis.pdf
Little Cross Family Clinic
 

Recently uploaded (20)

KDIGO 2024 guidelines for diabetologists
KDIGO 2024 guidelines for diabetologistsKDIGO 2024 guidelines for diabetologists
KDIGO 2024 guidelines for diabetologists
 
Maxilla, Mandible & Hyoid Bone & Clinical Correlations by Dr. RIG.pptx
Maxilla, Mandible & Hyoid Bone & Clinical Correlations by Dr. RIG.pptxMaxilla, Mandible & Hyoid Bone & Clinical Correlations by Dr. RIG.pptx
Maxilla, Mandible & Hyoid Bone & Clinical Correlations by Dr. RIG.pptx
 
New Drug Discovery and Development .....
New Drug Discovery and Development .....New Drug Discovery and Development .....
New Drug Discovery and Development .....
 
Cervical & Brachial Plexus By Dr. RIG.pptx
Cervical & Brachial Plexus By Dr. RIG.pptxCervical & Brachial Plexus By Dr. RIG.pptx
Cervical & Brachial Plexus By Dr. RIG.pptx
 
Hemodialysis: Chapter 3, Dialysis Water Unit - Dr.Gawad
Hemodialysis: Chapter 3, Dialysis Water Unit - Dr.GawadHemodialysis: Chapter 3, Dialysis Water Unit - Dr.Gawad
Hemodialysis: Chapter 3, Dialysis Water Unit - Dr.Gawad
 
Knee anatomy and clinical tests 2024.pdf
Knee anatomy and clinical tests 2024.pdfKnee anatomy and clinical tests 2024.pdf
Knee anatomy and clinical tests 2024.pdf
 
Tom Selleck Health: A Comprehensive Look at the Iconic Actor’s Wellness Journey
Tom Selleck Health: A Comprehensive Look at the Iconic Actor’s Wellness JourneyTom Selleck Health: A Comprehensive Look at the Iconic Actor’s Wellness Journey
Tom Selleck Health: A Comprehensive Look at the Iconic Actor’s Wellness Journey
 
ANATOMY AND PHYSIOLOGY OF URINARY SYSTEM.pptx
ANATOMY AND PHYSIOLOGY OF URINARY SYSTEM.pptxANATOMY AND PHYSIOLOGY OF URINARY SYSTEM.pptx
ANATOMY AND PHYSIOLOGY OF URINARY SYSTEM.pptx
 
Pharynx and Clinical Correlations BY Dr.Rabia Inam Gandapore.pptx
Pharynx and Clinical Correlations BY Dr.Rabia Inam Gandapore.pptxPharynx and Clinical Correlations BY Dr.Rabia Inam Gandapore.pptx
Pharynx and Clinical Correlations BY Dr.Rabia Inam Gandapore.pptx
 
micro teaching on communication m.sc nursing.pdf
micro teaching on communication m.sc nursing.pdfmicro teaching on communication m.sc nursing.pdf
micro teaching on communication m.sc nursing.pdf
 
How to Give Better Lectures: Some Tips for Doctors
How to Give Better Lectures: Some Tips for DoctorsHow to Give Better Lectures: Some Tips for Doctors
How to Give Better Lectures: Some Tips for Doctors
 
Triangles of Neck and Clinical Correlation by Dr. RIG.pptx
Triangles of Neck and Clinical Correlation by Dr. RIG.pptxTriangles of Neck and Clinical Correlation by Dr. RIG.pptx
Triangles of Neck and Clinical Correlation by Dr. RIG.pptx
 
ARTHROLOGY PPT NCISM SYLLABUS AYURVEDA STUDENTS
ARTHROLOGY PPT NCISM SYLLABUS AYURVEDA STUDENTSARTHROLOGY PPT NCISM SYLLABUS AYURVEDA STUDENTS
ARTHROLOGY PPT NCISM SYLLABUS AYURVEDA STUDENTS
 
Pictures of Superficial & Deep Fascia.ppt.pdf
Pictures of Superficial & Deep Fascia.ppt.pdfPictures of Superficial & Deep Fascia.ppt.pdf
Pictures of Superficial & Deep Fascia.ppt.pdf
 
Light House Retreats: Plant Medicine Retreat Europe
Light House Retreats: Plant Medicine Retreat EuropeLight House Retreats: Plant Medicine Retreat Europe
Light House Retreats: Plant Medicine Retreat Europe
 
Flu Vaccine Alert in Bangalore Karnataka
Flu Vaccine Alert in Bangalore KarnatakaFlu Vaccine Alert in Bangalore Karnataka
Flu Vaccine Alert in Bangalore Karnataka
 
Top 10 Best Ayurvedic Kidney Stone Syrups in India
Top 10 Best Ayurvedic Kidney Stone Syrups in IndiaTop 10 Best Ayurvedic Kidney Stone Syrups in India
Top 10 Best Ayurvedic Kidney Stone Syrups in India
 
263778731218 Abortion Clinic /Pills In Harare ,
263778731218 Abortion Clinic /Pills In Harare ,263778731218 Abortion Clinic /Pills In Harare ,
263778731218 Abortion Clinic /Pills In Harare ,
 
Non-respiratory Functions of the Lungs.pdf
Non-respiratory Functions of the Lungs.pdfNon-respiratory Functions of the Lungs.pdf
Non-respiratory Functions of the Lungs.pdf
 
Are There Any Natural Remedies To Treat Syphilis.pdf
Are There Any Natural Remedies To Treat Syphilis.pdfAre There Any Natural Remedies To Treat Syphilis.pdf
Are There Any Natural Remedies To Treat Syphilis.pdf
 

9. Regression

  • 1. KNOWLEDGE FOR THE BENEFIT OF HUMANITYKNOWLEDGE FOR THE BENEFIT OF HUMANITY BIOSTATISTICS (HFS3283) REGRESSION Dr.Dr. MohdMohd RazifRazif ShahrilShahril School of Nutrition & DieteticsSchool of Nutrition & Dietetics Faculty of Health SciencesFaculty of Health Sciences UniversitiUniversiti SultanSultan ZainalZainal AbidinAbidin 1
  • 2. S C H O O L O F N U T R I T I O N A N D D I E T E T I C S • U N I V E R S I T I S U L T A N Z A I N A L A B I D I N Topic Learning Outcomes At the end of this lecture, students should be able to; • identify types of regression analysis and their use. • explain assumptions to be met when using Simple Linear Regression. • perform Simple Linear Regression analysis using SPSS. • explain how to interpret the SPSS outputs from Simple Linear Regression analysis. 2
  • 3. S C H O O L O F N U T R I T I O N A N D D I E T E T I C S • U N I V E R S I T I S U L T A N Z A I N A L A B I D I N Regression • Regression analysis is the estimation of linear relationship between a dependent variable and one or more independent variables or covariates • Regression is used to predict the value of the dependent variable when value of independent variable(s) known • Does not imply causality • Regression analysis requires interval and ratio-level data. 3
  • 4. S C H O O L O F N U T R I T I O N A N D D I E T E T I C S • U N I V E R S I T I S U L T A N Z A I N A L A B I D I N Scatter Plot • To see if your data fits the models of regression, it is wise to conduct a scatter plot analysis. • The reason? – Regression analysis assumes a linear relationship. If you have a curvilinear relationship or no relationship, regression analysis is of little use. 4
  • 5. S C H O O L O F N U T R I T I O N A N D D I E T E T I C S • U N I V E R S I T I S U L T A N Z A I N A L A B I D I N Regression line • The best straight line description of the plotted points • Regression line is used to describe the association between the variables. 5
  • 6. S C H O O L O F N U T R I T I O N A N D D I E T E T I C S • U N I V E R S I T I S U L T A N Z A I N A L A B I D I N Beta (β) regression coefficient • Predicts the variation of dependent variable by changing one unit of explanatory (independent) variable. 6Sleeping (hours) Examscores 0 2 4 6 8 Y = a + βx Regression coefficientRegression coefficient (change in Y when X increases by 1) InterceptIntercept (value of Y when X=0) a{
  • 7. S C H O O L O F N U T R I T I O N A N D D I E T E T I C S • U N I V E R S I T I S U L T A N Z A I N A L A B I D I N Coefficient of determination, R2 • R2 represents how much proportion of the variation of dependent variable explained by the independent variable. – R2 = 1, indicates that the regression line perfectly fits the data – R2 = 0, indicates that the line does not fit the data at all. 7 R2 =0.75 Only 75% of Y changes explained by X. YChanges
  • 8. S C H O O L O F N U T R I T I O N A N D D I E T E T I C S • U N I V E R S I T I S U L T A N Z A I N A L A B I D I N Types of regression analysis • Simple Linear Regression – 1 numerical variable (dependent) vs. 1 numerical variable (independent) • Multiple Linear Regression – 1 numerical variable (dependent) vs. more than 1 numerical variable (independent) • Multivariable Linear Regression – 1 numerical variable (dependent) vs. more than 1 numerical or categorical variables (independent) • Multivariate Linear Regression – More than 1 numerical or categorical variables (dependent) vs. more than 1 numerical or categorical variables (independent) • Logistics Regression – 1 categorical variable (dependent) vs. more than 1 numerical or categorical variables (independent) 8
  • 9. S C H O O L O F N U T R I T I O N A N D D I E T E T I C S • U N I V E R S I T I S U L T A N Z A I N A L A B I D I N Research Q’s and Hypothesis Example; • Research Question – Is sleeping hours a predicting factor of exam scores? • Null Hypothesis (Ho: β = 0) – There is no linear relationship between the sleeping hours and exam scores • Alternate Hypothesis (Ha: β ≠ 0) – There is a significant linear relationship between the sleeping hours and exam scores 9
  • 10. S C H O O L O F N U T R I T I O N A N D D I E T E T I C S • U N I V E R S I T I S U L T A N Z A I N A L A B I D I N Assumptions • The data is drawn from a random sample of population. • The data is independent to each other. • The relationship between two variables must be linear. • There is normal distribution of y at any point of x. • There is equal variance of y at any point of x. 10
  • 11. S C H O O L O F N U T R I T I O N A N D D I E T E T I C S • U N I V E R S I T I S U L T A N Z A I N A L A B I D I N Assumptions 3 - Linearity 11 11 22 33
  • 12. S C H O O L O F N U T R I T I O N A N D D I E T E T I C S • U N I V E R S I T I S U L T A N Z A I N A L A B I D I N Assumptions 3 – Linearity (cont.) 12 44 55 66 77 Put the independent variablePut the independent variable into “X Axis” box Put the dependent variable into “Y Axis” box
  • 13. S C H O O L O F N U T R I T I O N A N D D I E T E T I C S • U N I V E R S I T I S U L T A N Z A I N A L A B I D I N Assumptions 3 – Linearity (cont.) To add regression line;To add regression line; Double click on the plots 88
  • 14. S C H O O L O F N U T R I T I O N A N D D I E T E T I C S • U N I V E R S I T I S U L T A N Z A I N A L A B I D I N Assumptions 3 – Linearity (cont.) 99 The relationship between twoThe relationship between two variables is linear
  • 15. S C H O O L O F N U T R I T I O N A N D D I E T E T I C S • U N I V E R S I T I S U L T A N Z A I N A L A B I D I N Assumptions 4 – Normal distribution
  • 16. S C H O O L O F N U T R I T I O N A N D D I E T E T I C S • U N I V E R S I T I S U L T A N Z A I N A L A B I D I N Assumptions 4 – Normal distribution (cont.)
  • 17. S C H O O L O F N U T R I T I O N A N D D I E T E T I C S • U N I V E R S I T I S U L T A N Z A I N A L A B I D I N Assumptions 5 – Equal variance
  • 18. S C H O O L O F N U T R I T I O N A N D D I E T E T I C S • U N I V E R S I T I S U L T A N Z A I N A L A B I D I N Assumptions 5 – Equal variance (cont.)
  • 19. S C H O O L O F N U T R I T I O N A N D D I E T E T I C S • U N I V E R S I T I S U L T A N Z A I N A L A B I D I N Assumptions 5 – Equal variance (cont.)
  • 20. S C H O O L O F N U T R I T I O N A N D D I E T E T I C S • U N I V E R S I T I S U L T A N Z A I N A L A B I D I N Simple Linear Regression in SPSS 11 22 33
  • 21. S C H O O L O F N U T R I T I O N A N D D I E T E T I C S • U N I V E R S I T I S U L T A N Z A I N A L A B I D I N Simple Linear Regression in SPSS 44 55 Put the independent variablePut the independent variable into “X Axis” box Put the dependent variable into “Y Axis” box
  • 22. S C H O O L O F N U T R I T I O N A N D D I E T E T I C S • U N I V E R S I T I S U L T A N Z A I N A L A B I D I N Simple Linear Regression in SPSS 66 88 77
  • 23. S C H O O L O F N U T R I T I O N A N D D I E T E T I C S • U N I V E R S I T I S U L T A N Z A I N A L A B I D I N Simple Linear Regression in SPSS 99
  • 24. S C H O O L O F N U T R I T I O N A N D D I E T E T I C S • U N I V E R S I T I S U L T A N Z A I N A L A B I D I N SPSS Output 11 • The table demonstrates the method used in this data analysis. • • The table demonstrates the method used in this data analysis. • No variable selection was carried out.
  • 25. S C H O O L O F N U T R I T I O N A N D D I E T E T I C S • U N I V E R S I T I S U L T A N Z A I N A L A B I D I N SPSS Output 22 The ‘Model Summary’ table shows the • • • • • The ‘Model Summary’ table shows the • Correlation coefficient (R) • Coefficient of determination (R2) • The correlation coefficient (r) is 0.463 and thus there is fair positive linear relationship between the two variable. • The coefficient of determination (r2) is 0.214. • Thus 21.4% of variation of exam scores is explained by sleeping hours.
  • 26. S C H O O L O F N U T R I T I O N A N D D I E T E T I C S • U N I V E R S I T I S U L T A N Z A I N A L A B I D I N SPSS Output 33 The ANOVA table explicates the p value of the relationship .The ANOVA table explicates the p value of the relationship .
  • 27. S C H O O L O F N U T R I T I O N A N D D I E T E T I C S • U N I V E R S I T I S U L T A N Z A I N A L A B I D I N SPSS Output 44 The coefficients table shows • • • The coefficients table shows • the slope of the line (β), • the intercept at y axis (constant), • the p value of the relationship. Y = a + β x
  • 28. S C H O O L O F N U T R I T I O N A N D D I E T E T I C S • U N I V E R S I T I S U L T A N Z A I N A L A B I D I N SPSS Output Interpretation • The slope of the regression line (β) is 3.456 with y axis intercept at 39.151. • Increase 1 hours of sleeping hours will increase 3.456 exam scores. • The regression equation: Exam scores = 39.151 + 3.456 (sleeping hours) • The p value is < 0.05, therefore reject null hypothesis. • There is a significant linear relationship between sleeping hours and exam scores (p<0.001). • Sleeping hours is a significant predicting factor for exam scores. 28
  • 29. S C H O O L O F N U T R I T I O N A N D D I E T E T I C S • U N I V E R S I T I S U L T A N Z A I N A L A B I D I N Results Presentation 29 β (95% CI) t statistics P value* R2 Sleeping hours 3.456 (3.166, 3.746) 23.354 < 0.001 0.214 Table: Relationship between sleeping hours and exam scores *Simple Linear Regression There is a significant linear between sleeping hours observed that an of There is a significant linear relationship between sleeping hours and exam scores (p<0.001). It is observed that an Increase 1 hours of sleeping hours will increase 3.456 exam scores. Sleeping hours is a significant predicting factor for exam scores.