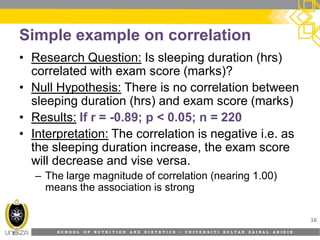
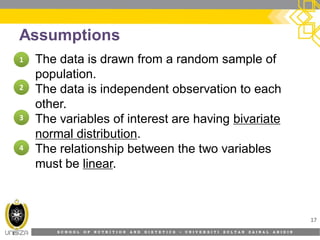
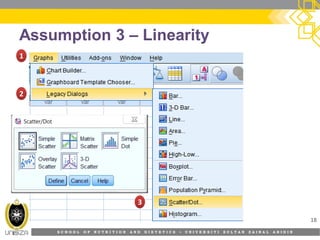
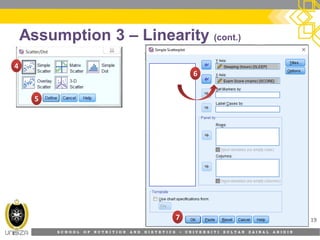
SlideShare a Scribd company logo
KNOWLEDGE FOR THE BENEFIT OF HUMANITYKNOWLEDGE FOR THE BENEFIT OF HUMANITY
BIOSTATISTICS (HFS3283)
CORRELATION
Dr.Dr. MohdMohd RazifRazif ShahrilShahril
School of Nutrition & DieteticsSchool of Nutrition & Dietetics
Faculty of Health SciencesFaculty of Health Sciences
UniversitiUniversiti SultanSultan ZainalZainal AbidinAbidin
1
S C H O O L O F N U T R I T I O N A N D D I E T E T I C S • U N I V E R S I T I S U L T A N Z A I N A L A B I D I N
Topic Learning Outcomes
At the end of this lecture, students should be able to;
• identify types of correlation analysis and when they are
used.
• explain assumptions to be met when using Pearson and
Spearman correlation.
• perform Pearson and Spearman correlation analysis
using SPSS.
• explain how to interpret the SPSS outputs from Pearson
and Spearman correlation analysis.
2
S C H O O L O F N U T R I T I O N A N D D I E T E T I C S • U N I V E R S I T I S U L T A N Z A I N A L A B I D I N
Correlation
• A measurement of the magnitude and direction
of two numerical variables
• The estimated correlation value may not be
100% accurate but the stronger is the
relationship, the more accurate the estimate.
• Involves mainly observation of a certain
relationship
– No control of manipulation imparted
– E.g. what is the correlation between sleeping hours
and BMI among UniSZA students
3
S C H O O L O F N U T R I T I O N A N D D I E T E T I C S • U N I V E R S I T I S U L T A N Z A I N A L A B I D I N
Aims for correlation
• To show three (3) important aspects involved in
an association:
– Type of correlation
– Direction of correlation
– Magnitude of correlation
4
S C H O O L O F N U T R I T I O N A N D D I E T E T I C S • U N I V E R S I T I S U L T A N Z A I N A L A B I D I N
Uses of correlation
• Prediction
– E.g. The SPM Trial exam results are used as selection
criteria into universities
• Validity
– To ensure an instrument measures what it should measure
– E.g. new digital thermometer vs. clinic thermometer
• Reliability
– To ensure an instrument always give consistent reading (if
other parameters are stable)
• Theory verification
– E.g. is it true that a relationship exists between an
individual’s IQ level and their brain size.
5
S C H O O L O F N U T R I T I O N A N D D I E T E T I C S • U N I V E R S I T I S U L T A N Z A I N A L A B I D I N
Bivariate distribution
• A distribution showing the association between
two (2) numerical variables
• Usually illustrated via the Scatter diagram/ plot
6
S C H O O L O F N U T R I T I O N A N D D I E T E T I C S • U N I V E R S I T I S U L T A N Z A I N A L A B I D I N
Pearson’s r
• The Pearson’s correlation coefficient, r provides
the magnitude of a correlation.
• According to Pearson’s mathematical procedure,
a correlation is linear.
• r ranges from 0 (no correlation) to +/- 1.0
(strongest correlation)
– The higher the value of r, the stronger is the
magnitude of correlation
– The symbols + or – indicate the direction of the
correlation
7
S C H O O L O F N U T R I T I O N A N D D I E T E T I C S • U N I V E R S I T I S U L T A N Z A I N A L A B I D I N
Characteristics of r
• Describes only linear correlation
• Sensitive towards variability (spread) and range
• Can be influenced by sampling variation
• Can be influenced by extreme/ outlier values
8
S C H O O L O F N U T R I T I O N A N D D I E T E T I C S • U N I V E R S I T I S U L T A N Z A I N A L A B I D I N
Types of correlation
• Three main types;
– Positive correlation (r = + ; variables change in the
same direction)
– Negative correlation (r = - ; variables change in the
opposite direction)
– Zero correlation (r = 0 ; both variable show no
association and direction)
9
S C H O O L O F N U T R I T I O N A N D D I E T E T I C S • U N I V E R S I T I S U L T A N Z A I N A L A B I D I N
Types of correlation (cont.)
10
S C H O O L O F N U T R I T I O N A N D D I E T E T I C S • U N I V E R S I T I S U L T A N Z A I N A L A B I D I N
Types of correlation (cont.)
11
S C H O O L O F N U T R I T I O N A N D D I E T E T I C S • U N I V E R S I T I S U L T A N Z A I N A L A B I D I N
Interpretation
• A relationship exits between two variables; X & Y
• Does not mean any change in X will also alter Y
• Does not involve causal relationship (e.g. X causes Y to
occur)
• If r = 0.50 does not mean 50% relationship
12
S C H O O L O F N U T R I T I O N A N D D I E T E T I C S • U N I V E R S I T I S U L T A N Z A I N A L A B I D I N
Interpretation (cont.)
CorrelationCorrelation InterpretationInterpretation
--1.00 to1.00 to --0.760.76 Strong negative correlationStrong negative correlation
--0.510.51 toto --0.750.75 Good negative correlationGood negative correlation
--0.50 to0.50 to --0.260.26 Fair negative correlationFair negative correlation
--0.25 to 0.010.25 to 0.01 Poor negative correlationPoor negative correlation
00 No correlationNo correlation
0.010.01 to 0.25to 0.25 Poor positive correlationPoor positive correlation
0.26 to 0.500.26 to 0.50 Fair positive correlationFair positive correlation
0.51 to 0.750.51 to 0.75 Good positive correlationGood positive correlation
0.76 to 1.000.76 to 1.00 Strong positive correlationStrong positive correlation
13
S C H O O L O F N U T R I T I O N A N D D I E T E T I C S • U N I V E R S I T I S U L T A N Z A I N A L A B I D I N
Linear vs. Non-linear correlation
• Not all correlations are linear
• Sometimes correlation can be non-linear e.g.
Curvilinear
– Score are concentrated on a curved line
• The Pearson’s coefficient is not suitable to
quantify this relationship
14
S C H O O L O F N U T R I T I O N A N D D I E T E T I C S • U N I V E R S I T I S U L T A N Z A I N A L A B I D I N
Linear vs. Non-linear correlation
15
Positive linear
r = 0.82
Negative linear
r = -0.70
Independent
r = 0.00
Curvilinear
r = 0.00
Curvilinear
r = 0.00
S C H O O L O F N U T R I T I O N A N D D I E T E T I C S • U N I V E R S I T I S U L T A N Z A I N A L A B I D I N
Simple example on correlation
• Research Question: Is sleeping duration (hrs)
correlated with exam score (marks)?
• Null Hypothesis: There is no correlation between
sleeping duration (hrs) and exam score (marks)
• Results: If r = -0.89; p < 0.05; n = 220
• Interpretation: The correlation is negative i.e. as
the sleeping duration increase, the exam score
will decrease and vise versa.
– The large magnitude of correlation (nearing 1.00)
means the association is strong
16
S C H O O L O F N U T R I T I O N A N D D I E T E T I C S • U N I V E R S I T I S U L T A N Z A I N A L A B I D I N
Assumptions
• The data is drawn from a random sample of
population.
• The data is independent observation to each
other.
• The variables of interest are having bivariate
normal distribution.
• The relationship between the two variables
must be linear.
17
11
22
33
44
S C H O O L O F N U T R I T I O N A N D D I E T E T I C S • U N I V E R S I T I S U L T A N Z A I N A L A B I D I N
Assumption 3 – Linearity
18
11
22
33
S C H O O L O F N U T R I T I O N A N D D I E T E T I C S • U N I V E R S I T I S U L T A N Z A I N A L A B I D I N
Assumption 3 – Linearity (cont.)
19
44
55
66
77
S C H O O L O F N U T R I T I O N A N D D I E T E T I C S • U N I V E R S I T I S U L T A N Z A I N A L A B I D I N
Assumption 3 – Linearity (cont.)
20
The relationship between the two variables is linear
based on the elliptical shape.
S C H O O L O F N U T R I T I O N A N D D I E T E T I C S • U N I V E R S I T I S U L T A N Z A I N A L A B I D I N
If assumptions are not met?
• If both variable does not meet all assumptions,
then use Spearmen’s correlation analysis.
– Values obtained would be Spearmen’s correlation
coefficient  (rho).
• If any one of the variable meet all assumption,
proceed with Pearson’s correlation analysis
– Values obtained is Pearson’s correlation coefficient r.
21
S C H O O L O F N U T R I T I O N A N D D I E T E T I C S • U N I V E R S I T I S U L T A N Z A I N A L A B I D I N
Correlation in SPSS
22
11
22 33
44
66
55
For normal distribution, we can use Pearson’s test.
For non-normal distribution, we can proceed to Spearman’s test.
S C H O O L O F N U T R I T I O N A N D D I E T E T I C S • U N I V E R S I T I S U L T A N Z A I N A L A B I D I N
SPSS Output
23
S C H O O L O F N U T R I T I O N A N D D I E T E T I C S • U N I V E R S I T I S U L T A N Z A I N A L A B I D I N
SPSS Output Interpretation
24
• In correlation, look at the correlation coefficient
which is the strength of relationship instead of
the p value.
– Even though the coefficient is weak, the p value is
usually significant depending upon the sample size.
• In this analysis the p value is < 0.05, therefore
we reject the null hypothesis.
S C H O O L O F N U T R I T I O N A N D D I E T E T I C S • U N I V E R S I T I S U L T A N Z A I N A L A B I D I N
SPSS Output Interpretation (cont.)
25
• There is a significant (linear) correlation between
sleeping duration and exam score (p< 0.001).
The observed correlation coefficient (r) is 0.337,
which suggests positive and fair correlation. It
suggests that higher the duration of sleeping,
the higher the exam scores.
S C H O O L O F N U T R I T I O N A N D D I E T E T I C S • U N I V E R S I T I S U L T A N Z A I N A L A B I D I N
Results presentation
26
Exam score (marks)
r p value*
Sleeping duration (hrs) 0. 337 < 0.001
* Pearson’s correlation
Table: Correlation between sleeping duration (hrs) and
exam score (marks)
Thank YouThank You
27

More Related Content

What's hot

Chi square test final
Chi square test finalChi square test final
Chi square test final
Har Jindal
 
Types of error in hypothesis
Types of error in hypothesisTypes of error in hypothesis
Types of error in hypothesis
Shaifali Pandey
 
Parametric and nonparametric test
Parametric and nonparametric testParametric and nonparametric test
Parametric and nonparametric test
ponnienselvi
 
Correlation
CorrelationCorrelation
Correlation
Anjali Awasthi
 
Parametric tests
Parametric testsParametric tests
Parametric tests
heena45
 
Sign test
Sign testSign test
Sign test
sukhpal0015
 
Non parametric test
Non parametric testNon parametric test
Non parametric test
dineshmeena53
 
Mpc 006 - 02-03 partial and multiple correlation
Mpc 006 - 02-03 partial and multiple correlationMpc 006 - 02-03 partial and multiple correlation
Mpc 006 - 02-03 partial and multiple correlation
Vasant Kothari
 
non parametric statistics
non parametric statisticsnon parametric statistics
non parametric statistics
Anchal Garg
 
Testing Hypothesis
Testing HypothesisTesting Hypothesis
Testing Hypothesis
Azmi Mohd Tamil
 
Hypothesis testing, error and bias
Hypothesis testing, error and biasHypothesis testing, error and bias
Hypothesis testing, error and bias
Dr.Jatin Chhaya
 
Ch4 Confidence Interval
Ch4 Confidence IntervalCh4 Confidence Interval
Ch4 Confidence Interval
Farhan Alfin
 
Correlation and regression
Correlation and regressionCorrelation and regression
Correlation and regression
Abdelaziz Tayoun
 
Meaning and types of correlation
Meaning and types of correlationMeaning and types of correlation
Meaning and types of correlation
Higher Education Department JK
 
Regression ppt
Regression pptRegression ppt
Regression ppt
Shraddha Tiwari
 
Statistical tests of significance and Student`s T-Test
Statistical tests of significance and Student`s T-TestStatistical tests of significance and Student`s T-Test
Statistical tests of significance and Student`s T-Test
VasundhraKakkar
 
Chi square
Chi squareChi square
Chi square
PoojaVishnoi7
 
Estimation and hypothesis testing 1 (graduate statistics2)
Estimation and hypothesis testing 1 (graduate statistics2)Estimation and hypothesis testing 1 (graduate statistics2)
Estimation and hypothesis testing 1 (graduate statistics2)Harve Abella
 
Correlation Analysis
Correlation AnalysisCorrelation Analysis
Correlation Analysis
Birinder Singh Gulati
 

What's hot (20)

Chi square test final
Chi square test finalChi square test final
Chi square test final
 
Types of error in hypothesis
Types of error in hypothesisTypes of error in hypothesis
Types of error in hypothesis
 
Non-Parametric Tests
Non-Parametric TestsNon-Parametric Tests
Non-Parametric Tests
 
Parametric and nonparametric test
Parametric and nonparametric testParametric and nonparametric test
Parametric and nonparametric test
 
Correlation
CorrelationCorrelation
Correlation
 
Parametric tests
Parametric testsParametric tests
Parametric tests
 
Sign test
Sign testSign test
Sign test
 
Non parametric test
Non parametric testNon parametric test
Non parametric test
 
Mpc 006 - 02-03 partial and multiple correlation
Mpc 006 - 02-03 partial and multiple correlationMpc 006 - 02-03 partial and multiple correlation
Mpc 006 - 02-03 partial and multiple correlation
 
non parametric statistics
non parametric statisticsnon parametric statistics
non parametric statistics
 
Testing Hypothesis
Testing HypothesisTesting Hypothesis
Testing Hypothesis
 
Hypothesis testing, error and bias
Hypothesis testing, error and biasHypothesis testing, error and bias
Hypothesis testing, error and bias
 
Ch4 Confidence Interval
Ch4 Confidence IntervalCh4 Confidence Interval
Ch4 Confidence Interval
 
Correlation and regression
Correlation and regressionCorrelation and regression
Correlation and regression
 
Meaning and types of correlation
Meaning and types of correlationMeaning and types of correlation
Meaning and types of correlation
 
Regression ppt
Regression pptRegression ppt
Regression ppt
 
Statistical tests of significance and Student`s T-Test
Statistical tests of significance and Student`s T-TestStatistical tests of significance and Student`s T-Test
Statistical tests of significance and Student`s T-Test
 
Chi square
Chi squareChi square
Chi square
 
Estimation and hypothesis testing 1 (graduate statistics2)
Estimation and hypothesis testing 1 (graduate statistics2)Estimation and hypothesis testing 1 (graduate statistics2)
Estimation and hypothesis testing 1 (graduate statistics2)
 
Correlation Analysis
Correlation AnalysisCorrelation Analysis
Correlation Analysis
 

Viewers also liked

1. Introduction to biostatistics
1. Introduction to biostatistics1. Introduction to biostatistics
1. Introduction to biostatistics
Razif Shahril
 
HFS3283 paired t tes-t and anova
HFS3283 paired t tes-t and anovaHFS3283 paired t tes-t and anova
HFS3283 paired t tes-t and anova
wajihahwafa
 
5. Non parametric analysis
5. Non parametric analysis5. Non parametric analysis
5. Non parametric analysis
Razif Shahril
 
9. Regression
9. Regression9. Regression
9. Regression
Razif Shahril
 
HFS 3283 independent t test
HFS 3283 independent t testHFS 3283 independent t test
HFS 3283 independent t test
wajihahwafa
 
2. Inferential statistics
2. Inferential statistics2. Inferential statistics
2. Inferential statistics
Razif Shahril
 
6. Categorical data analysis - Chi-Square & Fisher Exact Test
6. Categorical data analysis - Chi-Square & Fisher Exact Test6. Categorical data analysis - Chi-Square & Fisher Exact Test
6. Categorical data analysis - Chi-Square & Fisher Exact Test
Razif Shahril
 
Hypothesis testing; z test, t-test. f-test
Hypothesis testing; z test, t-test. f-testHypothesis testing; z test, t-test. f-test
Hypothesis testing; z test, t-test. f-test
Shakehand with Life
 
Correlation & Regression_
Correlation & Regression_Correlation & Regression_
Correlation & Regression_
Omar (TUBBS 128) Ventura VII
 
NDD10603
NDD10603 NDD10603
NDD10603
wajihahwafa
 
Multivariate statistics
Multivariate statisticsMultivariate statistics
Multivariate statisticsVeneficus
 
Theories Of Normality
Theories Of NormalityTheories Of Normality
Theories Of NormalityJade Sun
 
An introduction to denial of service attack
An introduction to denial of service attackAn introduction to denial of service attack
An introduction to denial of service attack
Mohammad Reza Mousavinasr
 
Hypothesis testng
Hypothesis testngHypothesis testng
Hypothesis testng
Omar (TUBBS 128) Ventura VII
 
dos attacks
dos attacksdos attacks
dos attacks
AMAL PERUMPALLIL
 
Scientific writing
Scientific writingScientific writing
Scientific writing
Razif Shahril
 
Dietetics cola presentation
Dietetics cola presentationDietetics cola presentation
Dietetics cola presentationVictoria Dehaas
 
Multivariate data analysis and visualization tools for biological data
Multivariate data analysis and visualization tools for biological dataMultivariate data analysis and visualization tools for biological data
Multivariate data analysis and visualization tools for biological dataDmitry Grapov
 

Viewers also liked (20)

1. Introduction to biostatistics
1. Introduction to biostatistics1. Introduction to biostatistics
1. Introduction to biostatistics
 
HFS3283 paired t tes-t and anova
HFS3283 paired t tes-t and anovaHFS3283 paired t tes-t and anova
HFS3283 paired t tes-t and anova
 
5. Non parametric analysis
5. Non parametric analysis5. Non parametric analysis
5. Non parametric analysis
 
9. Regression
9. Regression9. Regression
9. Regression
 
HFS 3283 independent t test
HFS 3283 independent t testHFS 3283 independent t test
HFS 3283 independent t test
 
2. Inferential statistics
2. Inferential statistics2. Inferential statistics
2. Inferential statistics
 
6. Categorical data analysis - Chi-Square & Fisher Exact Test
6. Categorical data analysis - Chi-Square & Fisher Exact Test6. Categorical data analysis - Chi-Square & Fisher Exact Test
6. Categorical data analysis - Chi-Square & Fisher Exact Test
 
Hypothesis testing; z test, t-test. f-test
Hypothesis testing; z test, t-test. f-testHypothesis testing; z test, t-test. f-test
Hypothesis testing; z test, t-test. f-test
 
Correlation & Regression_
Correlation & Regression_Correlation & Regression_
Correlation & Regression_
 
NDD10603
NDD10603 NDD10603
NDD10603
 
Multivariate statistics
Multivariate statisticsMultivariate statistics
Multivariate statistics
 
Multivariate
MultivariateMultivariate
Multivariate
 
Theories Of Normality
Theories Of NormalityTheories Of Normality
Theories Of Normality
 
An introduction to denial of service attack
An introduction to denial of service attackAn introduction to denial of service attack
An introduction to denial of service attack
 
Hypothesis testng
Hypothesis testngHypothesis testng
Hypothesis testng
 
dos attacks
dos attacksdos attacks
dos attacks
 
Scientific writing
Scientific writingScientific writing
Scientific writing
 
Dietetics cola presentation
Dietetics cola presentationDietetics cola presentation
Dietetics cola presentation
 
Multivariate data analysis and visualization tools for biological data
Multivariate data analysis and visualization tools for biological dataMultivariate data analysis and visualization tools for biological data
Multivariate data analysis and visualization tools for biological data
 
MULTIVARIATE STATISTICAL MODELS’ SYMBOLS
MULTIVARIATE STATISTICAL MODELS’ SYMBOLSMULTIVARIATE STATISTICAL MODELS’ SYMBOLS
MULTIVARIATE STATISTICAL MODELS’ SYMBOLS
 

Similar to 8. Correlation

ANOVA test and correlation
ANOVA test and correlationANOVA test and correlation
ANOVA test and correlation
Dr Lipilekha Patnaik
 
C6-CHI-SQUARE-OF-INDEPENDENCE.pdf
C6-CHI-SQUARE-OF-INDEPENDENCE.pdfC6-CHI-SQUARE-OF-INDEPENDENCE.pdf
C6-CHI-SQUARE-OF-INDEPENDENCE.pdf
EveGraceAlisbo
 
Artificial Intelligence (Unit - 8).pdf
Artificial Intelligence   (Unit  -  8).pdfArtificial Intelligence   (Unit  -  8).pdf
Artificial Intelligence (Unit - 8).pdf
SathyaNarayanan47813
 
Linear Correlation
Linear Correlation Linear Correlation
Linear Correlation
Tarek Tawfik Amin
 
Dr. A Sumathi - LINEARITY CONCEPT OF SIGNIFICANCE.pdf
Dr. A Sumathi - LINEARITY CONCEPT OF SIGNIFICANCE.pdfDr. A Sumathi - LINEARITY CONCEPT OF SIGNIFICANCE.pdf
Dr. A Sumathi - LINEARITY CONCEPT OF SIGNIFICANCE.pdf
Sumathi Arumugam
 
Biostatistics lecture notes 7.ppt
Biostatistics lecture notes 7.pptBiostatistics lecture notes 7.ppt
Biostatistics lecture notes 7.ppt
letayh2016
 
Correlation analysis
Correlation analysisCorrelation analysis
Correlation analysis
gopinathannsriramachandraeduin
 
Correlation and regression
Correlation and regressionCorrelation and regression
Correlation and regression
ANCYBS
 
Introduction to Statistical Methods
Introduction to Statistical MethodsIntroduction to Statistical Methods
Introduction to Statistical Methods
Michael770443
 
Lecture 3 ba 3 statistics for business analytics
Lecture 3 ba 3 statistics for business analyticsLecture 3 ba 3 statistics for business analytics
Lecture 3 ba 3 statistics for business analytics
yogesh ingle
 
13943056.ppt
13943056.ppt13943056.ppt
13943056.ppt
TinasheChatara1
 
Correlations
CorrelationsCorrelations
Inferential statistics correlations
Inferential statistics correlationsInferential statistics correlations
Inferential statistics correlations
Dhritiman Chakrabarti
 
how to select the appropriate method for our study of interest
how to select the appropriate method for our study of interest how to select the appropriate method for our study of interest
how to select the appropriate method for our study of interest
NurFathihaTahiatSeeu
 
Measure of Association
Measure of AssociationMeasure of Association
Measure of Association
Kalahandi University
 
2-20-04.ppt
2-20-04.ppt2-20-04.ppt
2-20-04.ppt
ayaan522797
 
Association between-variables
Association between-variablesAssociation between-variables
Association between-variables
Borhan Uddin
 

Similar to 8. Correlation (20)

Correlation
CorrelationCorrelation
Correlation
 
ANOVA test and correlation
ANOVA test and correlationANOVA test and correlation
ANOVA test and correlation
 
C6-CHI-SQUARE-OF-INDEPENDENCE.pdf
C6-CHI-SQUARE-OF-INDEPENDENCE.pdfC6-CHI-SQUARE-OF-INDEPENDENCE.pdf
C6-CHI-SQUARE-OF-INDEPENDENCE.pdf
 
Artificial Intelligence (Unit - 8).pdf
Artificial Intelligence   (Unit  -  8).pdfArtificial Intelligence   (Unit  -  8).pdf
Artificial Intelligence (Unit - 8).pdf
 
Linear Correlation
Linear Correlation Linear Correlation
Linear Correlation
 
Dr. A Sumathi - LINEARITY CONCEPT OF SIGNIFICANCE.pdf
Dr. A Sumathi - LINEARITY CONCEPT OF SIGNIFICANCE.pdfDr. A Sumathi - LINEARITY CONCEPT OF SIGNIFICANCE.pdf
Dr. A Sumathi - LINEARITY CONCEPT OF SIGNIFICANCE.pdf
 
Biostatistics lecture notes 7.ppt
Biostatistics lecture notes 7.pptBiostatistics lecture notes 7.ppt
Biostatistics lecture notes 7.ppt
 
Correlation analysis
Correlation analysisCorrelation analysis
Correlation analysis
 
Correlation and regression
Correlation and regressionCorrelation and regression
Correlation and regression
 
Introduction to Statistical Methods
Introduction to Statistical MethodsIntroduction to Statistical Methods
Introduction to Statistical Methods
 
Lecture 3 ba 3 statistics for business analytics
Lecture 3 ba 3 statistics for business analyticsLecture 3 ba 3 statistics for business analytics
Lecture 3 ba 3 statistics for business analytics
 
13943056.ppt
13943056.ppt13943056.ppt
13943056.ppt
 
Correlations
CorrelationsCorrelations
Correlations
 
Inferential statistics correlations
Inferential statistics correlationsInferential statistics correlations
Inferential statistics correlations
 
how to select the appropriate method for our study of interest
how to select the appropriate method for our study of interest how to select the appropriate method for our study of interest
how to select the appropriate method for our study of interest
 
Measure of Association
Measure of AssociationMeasure of Association
Measure of Association
 
Simple correlation
Simple correlationSimple correlation
Simple correlation
 
Simple linear regressionn and Correlation
Simple linear regressionn and CorrelationSimple linear regressionn and Correlation
Simple linear regressionn and Correlation
 
2-20-04.ppt
2-20-04.ppt2-20-04.ppt
2-20-04.ppt
 
Association between-variables
Association between-variablesAssociation between-variables
Association between-variables
 

More from Razif Shahril

10. Ethical issues
10. Ethical issues10. Ethical issues
10. Ethical issues
Razif Shahril
 
11. Processing and displaying data
11. Processing and displaying data11. Processing and displaying data
11. Processing and displaying data
Razif Shahril
 
9. Selecting a sample
9. Selecting a sample9. Selecting a sample
9. Selecting a sample
Razif Shahril
 
8. validity and reliability of research instruments
8. validity and reliability of research instruments8. validity and reliability of research instruments
8. validity and reliability of research instruments
Razif Shahril
 
8. Preparing the report
8. Preparing the report8. Preparing the report
8. Preparing the report
Razif Shahril
 
7. Selecting a data collection method
7. Selecting a data collection method7. Selecting a data collection method
7. Selecting a data collection method
Razif Shahril
 
6. Selecting a study design
6. Selecting a study design6. Selecting a study design
6. Selecting a study design
Razif Shahril
 
5. Identifying variables and constructing hypothesis
5. Identifying variables and constructing hypothesis5. Identifying variables and constructing hypothesis
5. Identifying variables and constructing hypothesis
Razif Shahril
 
4. Formulating research problems
4. Formulating research problems4. Formulating research problems
4. Formulating research problems
Razif Shahril
 
3. Reviewing the literature
3. Reviewing the literature3. Reviewing the literature
3. Reviewing the literature
Razif Shahril
 
1. Prelude + Introduction to Research Methodology
1. Prelude +  Introduction to Research Methodology1. Prelude +  Introduction to Research Methodology
1. Prelude + Introduction to Research Methodology
Razif Shahril
 
5. Case control
5. Case control5. Case control
5. Case control
Razif Shahril
 
6. Randomised controlled trial
6. Randomised controlled trial6. Randomised controlled trial
6. Randomised controlled trial
Razif Shahril
 
4. Cohort
4. Cohort4. Cohort
4. Cohort
Razif Shahril
 
3. Cross sectional
3. Cross sectional3. Cross sectional
3. Cross sectional
Razif Shahril
 
2. Case study and case series
2. Case study and case series2. Case study and case series
2. Case study and case series
Razif Shahril
 
1. Introduction to epidemiological study designs
1. Introduction to epidemiological study designs1. Introduction to epidemiological study designs
1. Introduction to epidemiological study designs
Razif Shahril
 
6. Glycemic index
6. Glycemic index6. Glycemic index
6. Glycemic index
Razif Shahril
 
5. Nutrition in emergencies
5. Nutrition in emergencies5. Nutrition in emergencies
5. Nutrition in emergencies
Razif Shahril
 
4. World Hunger
4. World Hunger4. World Hunger
4. World Hunger
Razif Shahril
 

More from Razif Shahril (20)

10. Ethical issues
10. Ethical issues10. Ethical issues
10. Ethical issues
 
11. Processing and displaying data
11. Processing and displaying data11. Processing and displaying data
11. Processing and displaying data
 
9. Selecting a sample
9. Selecting a sample9. Selecting a sample
9. Selecting a sample
 
8. validity and reliability of research instruments
8. validity and reliability of research instruments8. validity and reliability of research instruments
8. validity and reliability of research instruments
 
8. Preparing the report
8. Preparing the report8. Preparing the report
8. Preparing the report
 
7. Selecting a data collection method
7. Selecting a data collection method7. Selecting a data collection method
7. Selecting a data collection method
 
6. Selecting a study design
6. Selecting a study design6. Selecting a study design
6. Selecting a study design
 
5. Identifying variables and constructing hypothesis
5. Identifying variables and constructing hypothesis5. Identifying variables and constructing hypothesis
5. Identifying variables and constructing hypothesis
 
4. Formulating research problems
4. Formulating research problems4. Formulating research problems
4. Formulating research problems
 
3. Reviewing the literature
3. Reviewing the literature3. Reviewing the literature
3. Reviewing the literature
 
1. Prelude + Introduction to Research Methodology
1. Prelude +  Introduction to Research Methodology1. Prelude +  Introduction to Research Methodology
1. Prelude + Introduction to Research Methodology
 
5. Case control
5. Case control5. Case control
5. Case control
 
6. Randomised controlled trial
6. Randomised controlled trial6. Randomised controlled trial
6. Randomised controlled trial
 
4. Cohort
4. Cohort4. Cohort
4. Cohort
 
3. Cross sectional
3. Cross sectional3. Cross sectional
3. Cross sectional
 
2. Case study and case series
2. Case study and case series2. Case study and case series
2. Case study and case series
 
1. Introduction to epidemiological study designs
1. Introduction to epidemiological study designs1. Introduction to epidemiological study designs
1. Introduction to epidemiological study designs
 
6. Glycemic index
6. Glycemic index6. Glycemic index
6. Glycemic index
 
5. Nutrition in emergencies
5. Nutrition in emergencies5. Nutrition in emergencies
5. Nutrition in emergencies
 
4. World Hunger
4. World Hunger4. World Hunger
4. World Hunger
 

Recently uploaded

24 Upakrama.pptx class ppt useful in all
24 Upakrama.pptx class ppt useful in all24 Upakrama.pptx class ppt useful in all
24 Upakrama.pptx class ppt useful in all
DrSathishMS1
 
POST OPERATIVE OLIGURIA and its management
POST OPERATIVE OLIGURIA and its managementPOST OPERATIVE OLIGURIA and its management
POST OPERATIVE OLIGURIA and its management
touseefaziz1
 
263778731218 Abortion Clinic /Pills In Harare ,
263778731218 Abortion Clinic /Pills In Harare ,263778731218 Abortion Clinic /Pills In Harare ,
263778731218 Abortion Clinic /Pills In Harare ,
sisternakatoto
 
ANATOMY AND PHYSIOLOGY OF URINARY SYSTEM.pptx
ANATOMY AND PHYSIOLOGY OF URINARY SYSTEM.pptxANATOMY AND PHYSIOLOGY OF URINARY SYSTEM.pptx
ANATOMY AND PHYSIOLOGY OF URINARY SYSTEM.pptx
Swetaba Besh
 
ACUTE SCROTUM.....pdf. ACUTE SCROTAL CONDITIOND
ACUTE SCROTUM.....pdf. ACUTE SCROTAL CONDITIONDACUTE SCROTUM.....pdf. ACUTE SCROTAL CONDITIOND
ACUTE SCROTUM.....pdf. ACUTE SCROTAL CONDITIOND
DR SETH JOTHAM
 
New Drug Discovery and Development .....
New Drug Discovery and Development .....New Drug Discovery and Development .....
New Drug Discovery and Development .....
NEHA GUPTA
 
Report Back from SGO 2024: What’s the Latest in Cervical Cancer?
Report Back from SGO 2024: What’s the Latest in Cervical Cancer?Report Back from SGO 2024: What’s the Latest in Cervical Cancer?
Report Back from SGO 2024: What’s the Latest in Cervical Cancer?
bkling
 
How to Give Better Lectures: Some Tips for Doctors
How to Give Better Lectures: Some Tips for DoctorsHow to Give Better Lectures: Some Tips for Doctors
How to Give Better Lectures: Some Tips for Doctors
LanceCatedral
 
KDIGO 2024 guidelines for diabetologists
KDIGO 2024 guidelines for diabetologistsKDIGO 2024 guidelines for diabetologists
KDIGO 2024 guidelines for diabetologists
د.محمود نجيب
 
TEST BANK for Operations Management, 14th Edition by William J. Stevenson, Ve...
TEST BANK for Operations Management, 14th Edition by William J. Stevenson, Ve...TEST BANK for Operations Management, 14th Edition by William J. Stevenson, Ve...
TEST BANK for Operations Management, 14th Edition by William J. Stevenson, Ve...
kevinkariuki227
 
micro teaching on communication m.sc nursing.pdf
micro teaching on communication m.sc nursing.pdfmicro teaching on communication m.sc nursing.pdf
micro teaching on communication m.sc nursing.pdf
Anurag Sharma
 
Surat @ℂall @Girls ꧁❤8527049040❤꧂@ℂall @Girls Service Vip Top Model Safe
Surat @ℂall @Girls ꧁❤8527049040❤꧂@ℂall @Girls Service Vip Top Model SafeSurat @ℂall @Girls ꧁❤8527049040❤꧂@ℂall @Girls Service Vip Top Model Safe
Surat @ℂall @Girls ꧁❤8527049040❤꧂@ℂall @Girls Service Vip Top Model Safe
Savita Shen $i11
 
Non-respiratory Functions of the Lungs.pdf
Non-respiratory Functions of the Lungs.pdfNon-respiratory Functions of the Lungs.pdf
Non-respiratory Functions of the Lungs.pdf
MedicoseAcademics
 
Ozempic: Preoperative Management of Patients on GLP-1 Receptor Agonists
Ozempic: Preoperative Management of Patients on GLP-1 Receptor Agonists  Ozempic: Preoperative Management of Patients on GLP-1 Receptor Agonists
Ozempic: Preoperative Management of Patients on GLP-1 Receptor Agonists
Saeid Safari
 
heat stroke and heat exhaustion in children
heat stroke and heat exhaustion in childrenheat stroke and heat exhaustion in children
heat stroke and heat exhaustion in children
SumeraAhmad5
 
Novas diretrizes da OMS para os cuidados perinatais de mais qualidade
Novas diretrizes da OMS para os cuidados perinatais de mais qualidadeNovas diretrizes da OMS para os cuidados perinatais de mais qualidade
Novas diretrizes da OMS para os cuidados perinatais de mais qualidade
Prof. Marcus Renato de Carvalho
 
HOT NEW PRODUCT! BIG SALES FAST SHIPPING NOW FROM CHINA!! EU KU DB BK substit...
HOT NEW PRODUCT! BIG SALES FAST SHIPPING NOW FROM CHINA!! EU KU DB BK substit...HOT NEW PRODUCT! BIG SALES FAST SHIPPING NOW FROM CHINA!! EU KU DB BK substit...
HOT NEW PRODUCT! BIG SALES FAST SHIPPING NOW FROM CHINA!! EU KU DB BK substit...
GL Anaacs
 
Flu Vaccine Alert in Bangalore Karnataka
Flu Vaccine Alert in Bangalore KarnatakaFlu Vaccine Alert in Bangalore Karnataka
Flu Vaccine Alert in Bangalore Karnataka
addon Scans
 
Prix Galien International 2024 Forum Program
Prix Galien International 2024 Forum ProgramPrix Galien International 2024 Forum Program
Prix Galien International 2024 Forum Program
Levi Shapiro
 
Evaluation of antidepressant activity of clitoris ternatea in animals
Evaluation of antidepressant activity of clitoris ternatea in animalsEvaluation of antidepressant activity of clitoris ternatea in animals
Evaluation of antidepressant activity of clitoris ternatea in animals
Shweta
 

Recently uploaded (20)

24 Upakrama.pptx class ppt useful in all
24 Upakrama.pptx class ppt useful in all24 Upakrama.pptx class ppt useful in all
24 Upakrama.pptx class ppt useful in all
 
POST OPERATIVE OLIGURIA and its management
POST OPERATIVE OLIGURIA and its managementPOST OPERATIVE OLIGURIA and its management
POST OPERATIVE OLIGURIA and its management
 
263778731218 Abortion Clinic /Pills In Harare ,
263778731218 Abortion Clinic /Pills In Harare ,263778731218 Abortion Clinic /Pills In Harare ,
263778731218 Abortion Clinic /Pills In Harare ,
 
ANATOMY AND PHYSIOLOGY OF URINARY SYSTEM.pptx
ANATOMY AND PHYSIOLOGY OF URINARY SYSTEM.pptxANATOMY AND PHYSIOLOGY OF URINARY SYSTEM.pptx
ANATOMY AND PHYSIOLOGY OF URINARY SYSTEM.pptx
 
ACUTE SCROTUM.....pdf. ACUTE SCROTAL CONDITIOND
ACUTE SCROTUM.....pdf. ACUTE SCROTAL CONDITIONDACUTE SCROTUM.....pdf. ACUTE SCROTAL CONDITIOND
ACUTE SCROTUM.....pdf. ACUTE SCROTAL CONDITIOND
 
New Drug Discovery and Development .....
New Drug Discovery and Development .....New Drug Discovery and Development .....
New Drug Discovery and Development .....
 
Report Back from SGO 2024: What’s the Latest in Cervical Cancer?
Report Back from SGO 2024: What’s the Latest in Cervical Cancer?Report Back from SGO 2024: What’s the Latest in Cervical Cancer?
Report Back from SGO 2024: What’s the Latest in Cervical Cancer?
 
How to Give Better Lectures: Some Tips for Doctors
How to Give Better Lectures: Some Tips for DoctorsHow to Give Better Lectures: Some Tips for Doctors
How to Give Better Lectures: Some Tips for Doctors
 
KDIGO 2024 guidelines for diabetologists
KDIGO 2024 guidelines for diabetologistsKDIGO 2024 guidelines for diabetologists
KDIGO 2024 guidelines for diabetologists
 
TEST BANK for Operations Management, 14th Edition by William J. Stevenson, Ve...
TEST BANK for Operations Management, 14th Edition by William J. Stevenson, Ve...TEST BANK for Operations Management, 14th Edition by William J. Stevenson, Ve...
TEST BANK for Operations Management, 14th Edition by William J. Stevenson, Ve...
 
micro teaching on communication m.sc nursing.pdf
micro teaching on communication m.sc nursing.pdfmicro teaching on communication m.sc nursing.pdf
micro teaching on communication m.sc nursing.pdf
 
Surat @ℂall @Girls ꧁❤8527049040❤꧂@ℂall @Girls Service Vip Top Model Safe
Surat @ℂall @Girls ꧁❤8527049040❤꧂@ℂall @Girls Service Vip Top Model SafeSurat @ℂall @Girls ꧁❤8527049040❤꧂@ℂall @Girls Service Vip Top Model Safe
Surat @ℂall @Girls ꧁❤8527049040❤꧂@ℂall @Girls Service Vip Top Model Safe
 
Non-respiratory Functions of the Lungs.pdf
Non-respiratory Functions of the Lungs.pdfNon-respiratory Functions of the Lungs.pdf
Non-respiratory Functions of the Lungs.pdf
 
Ozempic: Preoperative Management of Patients on GLP-1 Receptor Agonists
Ozempic: Preoperative Management of Patients on GLP-1 Receptor Agonists  Ozempic: Preoperative Management of Patients on GLP-1 Receptor Agonists
Ozempic: Preoperative Management of Patients on GLP-1 Receptor Agonists
 
heat stroke and heat exhaustion in children
heat stroke and heat exhaustion in childrenheat stroke and heat exhaustion in children
heat stroke and heat exhaustion in children
 
Novas diretrizes da OMS para os cuidados perinatais de mais qualidade
Novas diretrizes da OMS para os cuidados perinatais de mais qualidadeNovas diretrizes da OMS para os cuidados perinatais de mais qualidade
Novas diretrizes da OMS para os cuidados perinatais de mais qualidade
 
HOT NEW PRODUCT! BIG SALES FAST SHIPPING NOW FROM CHINA!! EU KU DB BK substit...
HOT NEW PRODUCT! BIG SALES FAST SHIPPING NOW FROM CHINA!! EU KU DB BK substit...HOT NEW PRODUCT! BIG SALES FAST SHIPPING NOW FROM CHINA!! EU KU DB BK substit...
HOT NEW PRODUCT! BIG SALES FAST SHIPPING NOW FROM CHINA!! EU KU DB BK substit...
 
Flu Vaccine Alert in Bangalore Karnataka
Flu Vaccine Alert in Bangalore KarnatakaFlu Vaccine Alert in Bangalore Karnataka
Flu Vaccine Alert in Bangalore Karnataka
 
Prix Galien International 2024 Forum Program
Prix Galien International 2024 Forum ProgramPrix Galien International 2024 Forum Program
Prix Galien International 2024 Forum Program
 
Evaluation of antidepressant activity of clitoris ternatea in animals
Evaluation of antidepressant activity of clitoris ternatea in animalsEvaluation of antidepressant activity of clitoris ternatea in animals
Evaluation of antidepressant activity of clitoris ternatea in animals
 

8. Correlation

  • 1. KNOWLEDGE FOR THE BENEFIT OF HUMANITYKNOWLEDGE FOR THE BENEFIT OF HUMANITY BIOSTATISTICS (HFS3283) CORRELATION Dr.Dr. MohdMohd RazifRazif ShahrilShahril School of Nutrition & DieteticsSchool of Nutrition & Dietetics Faculty of Health SciencesFaculty of Health Sciences UniversitiUniversiti SultanSultan ZainalZainal AbidinAbidin 1
  • 2. S C H O O L O F N U T R I T I O N A N D D I E T E T I C S • U N I V E R S I T I S U L T A N Z A I N A L A B I D I N Topic Learning Outcomes At the end of this lecture, students should be able to; • identify types of correlation analysis and when they are used. • explain assumptions to be met when using Pearson and Spearman correlation. • perform Pearson and Spearman correlation analysis using SPSS. • explain how to interpret the SPSS outputs from Pearson and Spearman correlation analysis. 2
  • 3. S C H O O L O F N U T R I T I O N A N D D I E T E T I C S • U N I V E R S I T I S U L T A N Z A I N A L A B I D I N Correlation • A measurement of the magnitude and direction of two numerical variables • The estimated correlation value may not be 100% accurate but the stronger is the relationship, the more accurate the estimate. • Involves mainly observation of a certain relationship – No control of manipulation imparted – E.g. what is the correlation between sleeping hours and BMI among UniSZA students 3
  • 4. S C H O O L O F N U T R I T I O N A N D D I E T E T I C S • U N I V E R S I T I S U L T A N Z A I N A L A B I D I N Aims for correlation • To show three (3) important aspects involved in an association: – Type of correlation – Direction of correlation – Magnitude of correlation 4
  • 5. S C H O O L O F N U T R I T I O N A N D D I E T E T I C S • U N I V E R S I T I S U L T A N Z A I N A L A B I D I N Uses of correlation • Prediction – E.g. The SPM Trial exam results are used as selection criteria into universities • Validity – To ensure an instrument measures what it should measure – E.g. new digital thermometer vs. clinic thermometer • Reliability – To ensure an instrument always give consistent reading (if other parameters are stable) • Theory verification – E.g. is it true that a relationship exists between an individual’s IQ level and their brain size. 5
  • 6. S C H O O L O F N U T R I T I O N A N D D I E T E T I C S • U N I V E R S I T I S U L T A N Z A I N A L A B I D I N Bivariate distribution • A distribution showing the association between two (2) numerical variables • Usually illustrated via the Scatter diagram/ plot 6
  • 7. S C H O O L O F N U T R I T I O N A N D D I E T E T I C S • U N I V E R S I T I S U L T A N Z A I N A L A B I D I N Pearson’s r • The Pearson’s correlation coefficient, r provides the magnitude of a correlation. • According to Pearson’s mathematical procedure, a correlation is linear. • r ranges from 0 (no correlation) to +/- 1.0 (strongest correlation) – The higher the value of r, the stronger is the magnitude of correlation – The symbols + or – indicate the direction of the correlation 7
  • 8. S C H O O L O F N U T R I T I O N A N D D I E T E T I C S • U N I V E R S I T I S U L T A N Z A I N A L A B I D I N Characteristics of r • Describes only linear correlation • Sensitive towards variability (spread) and range • Can be influenced by sampling variation • Can be influenced by extreme/ outlier values 8
  • 9. S C H O O L O F N U T R I T I O N A N D D I E T E T I C S • U N I V E R S I T I S U L T A N Z A I N A L A B I D I N Types of correlation • Three main types; – Positive correlation (r = + ; variables change in the same direction) – Negative correlation (r = - ; variables change in the opposite direction) – Zero correlation (r = 0 ; both variable show no association and direction) 9
  • 10. S C H O O L O F N U T R I T I O N A N D D I E T E T I C S • U N I V E R S I T I S U L T A N Z A I N A L A B I D I N Types of correlation (cont.) 10
  • 11. S C H O O L O F N U T R I T I O N A N D D I E T E T I C S • U N I V E R S I T I S U L T A N Z A I N A L A B I D I N Types of correlation (cont.) 11
  • 12. S C H O O L O F N U T R I T I O N A N D D I E T E T I C S • U N I V E R S I T I S U L T A N Z A I N A L A B I D I N Interpretation • A relationship exits between two variables; X & Y • Does not mean any change in X will also alter Y • Does not involve causal relationship (e.g. X causes Y to occur) • If r = 0.50 does not mean 50% relationship 12
  • 13. S C H O O L O F N U T R I T I O N A N D D I E T E T I C S • U N I V E R S I T I S U L T A N Z A I N A L A B I D I N Interpretation (cont.) CorrelationCorrelation InterpretationInterpretation --1.00 to1.00 to --0.760.76 Strong negative correlationStrong negative correlation --0.510.51 toto --0.750.75 Good negative correlationGood negative correlation --0.50 to0.50 to --0.260.26 Fair negative correlationFair negative correlation --0.25 to 0.010.25 to 0.01 Poor negative correlationPoor negative correlation 00 No correlationNo correlation 0.010.01 to 0.25to 0.25 Poor positive correlationPoor positive correlation 0.26 to 0.500.26 to 0.50 Fair positive correlationFair positive correlation 0.51 to 0.750.51 to 0.75 Good positive correlationGood positive correlation 0.76 to 1.000.76 to 1.00 Strong positive correlationStrong positive correlation 13
  • 14. S C H O O L O F N U T R I T I O N A N D D I E T E T I C S • U N I V E R S I T I S U L T A N Z A I N A L A B I D I N Linear vs. Non-linear correlation • Not all correlations are linear • Sometimes correlation can be non-linear e.g. Curvilinear – Score are concentrated on a curved line • The Pearson’s coefficient is not suitable to quantify this relationship 14
  • 15. S C H O O L O F N U T R I T I O N A N D D I E T E T I C S • U N I V E R S I T I S U L T A N Z A I N A L A B I D I N Linear vs. Non-linear correlation 15 Positive linear r = 0.82 Negative linear r = -0.70 Independent r = 0.00 Curvilinear r = 0.00 Curvilinear r = 0.00
  • 16. S C H O O L O F N U T R I T I O N A N D D I E T E T I C S • U N I V E R S I T I S U L T A N Z A I N A L A B I D I N Simple example on correlation • Research Question: Is sleeping duration (hrs) correlated with exam score (marks)? • Null Hypothesis: There is no correlation between sleeping duration (hrs) and exam score (marks) • Results: If r = -0.89; p < 0.05; n = 220 • Interpretation: The correlation is negative i.e. as the sleeping duration increase, the exam score will decrease and vise versa. – The large magnitude of correlation (nearing 1.00) means the association is strong 16
  • 17. S C H O O L O F N U T R I T I O N A N D D I E T E T I C S • U N I V E R S I T I S U L T A N Z A I N A L A B I D I N Assumptions • The data is drawn from a random sample of population. • The data is independent observation to each other. • The variables of interest are having bivariate normal distribution. • The relationship between the two variables must be linear. 17 11 22 33 44
  • 18. S C H O O L O F N U T R I T I O N A N D D I E T E T I C S • U N I V E R S I T I S U L T A N Z A I N A L A B I D I N Assumption 3 – Linearity 18 11 22 33
  • 19. S C H O O L O F N U T R I T I O N A N D D I E T E T I C S • U N I V E R S I T I S U L T A N Z A I N A L A B I D I N Assumption 3 – Linearity (cont.) 19 44 55 66 77
  • 20. S C H O O L O F N U T R I T I O N A N D D I E T E T I C S • U N I V E R S I T I S U L T A N Z A I N A L A B I D I N Assumption 3 – Linearity (cont.) 20 The relationship between the two variables is linear based on the elliptical shape.
  • 21. S C H O O L O F N U T R I T I O N A N D D I E T E T I C S • U N I V E R S I T I S U L T A N Z A I N A L A B I D I N If assumptions are not met? • If both variable does not meet all assumptions, then use Spearmen’s correlation analysis. – Values obtained would be Spearmen’s correlation coefficient  (rho). • If any one of the variable meet all assumption, proceed with Pearson’s correlation analysis – Values obtained is Pearson’s correlation coefficient r. 21
  • 22. S C H O O L O F N U T R I T I O N A N D D I E T E T I C S • U N I V E R S I T I S U L T A N Z A I N A L A B I D I N Correlation in SPSS 22 11 22 33 44 66 55 For normal distribution, we can use Pearson’s test. For non-normal distribution, we can proceed to Spearman’s test.
  • 23. S C H O O L O F N U T R I T I O N A N D D I E T E T I C S • U N I V E R S I T I S U L T A N Z A I N A L A B I D I N SPSS Output 23
  • 24. S C H O O L O F N U T R I T I O N A N D D I E T E T I C S • U N I V E R S I T I S U L T A N Z A I N A L A B I D I N SPSS Output Interpretation 24 • In correlation, look at the correlation coefficient which is the strength of relationship instead of the p value. – Even though the coefficient is weak, the p value is usually significant depending upon the sample size. • In this analysis the p value is < 0.05, therefore we reject the null hypothesis.
  • 25. S C H O O L O F N U T R I T I O N A N D D I E T E T I C S • U N I V E R S I T I S U L T A N Z A I N A L A B I D I N SPSS Output Interpretation (cont.) 25 • There is a significant (linear) correlation between sleeping duration and exam score (p< 0.001). The observed correlation coefficient (r) is 0.337, which suggests positive and fair correlation. It suggests that higher the duration of sleeping, the higher the exam scores.
  • 26. S C H O O L O F N U T R I T I O N A N D D I E T E T I C S • U N I V E R S I T I S U L T A N Z A I N A L A B I D I N Results presentation 26 Exam score (marks) r p value* Sleeping duration (hrs) 0. 337 < 0.001 * Pearson’s correlation Table: Correlation between sleeping duration (hrs) and exam score (marks)