
Recommended
More Related Content
What's hot
What's hot (20)
Viewers also liked
Viewers also liked (12)
Similar to Currency high lights 11.01.17
Similar to Currency high lights 11.01.17 (20)
Recently uploaded
Recently uploaded (20)
Currency high lights 11.01.17
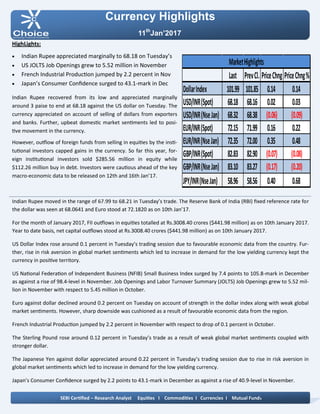
- 1. Currency Highlights 11th Jan’2017 HighLights: Indian Rupee appreciated marginally to 68.18 on Tuesday’s US JOLTS Job Openings grew to 5.52 million in November French Industrial Production jumped by 2.2 percent in Nov Japan’s Consumer Confidence surged to 43.1-mark in Dec Indian Rupee recovered from its low and appreciated marginally around 3 paise to end at 68.18 against the US dollar on Tuesday. The currency appreciated on account of selling of dollars from exporters and banks. Further, upbeat domestic market sentiments led to posi- tive movement in the currency. However, outflow of foreign funds from selling in equities by the insti- tutional investors capped gains in the currency. So far this year, for- eign institutional investors sold $285.56 million in equity while $112.26 million buy in debt. Investors were cautious ahead of the key macro-economic data to be released on 12th and 16th Jan’17. Indian Rupee moved in the range of 67.99 to 68.21 in Tuesday’s trade. The Reserve Bank of India (RBI) fixed reference rate for the dollar was seen at 68.0641 and Euro stood at 72.1820 as on 10th Jan’17. For the month of January 2017, FII outflows in equities totalled at Rs.3008.40 crores ($441.98 million) as on 10th January 2017. Year to date basis, net capital outflows stood at Rs.3008.40 crores ($441.98 million) as on 10th January 2017. US Dollar Index rose around 0.1 percent in Tuesday’s trading session due to favourable economic data from the country. Fur- ther, rise in risk aversion in global market sentiments which led to increase in demand for the low yielding currency kept the currency in positive territory. US National Federation of Independent Business (NFIB) Small Business Index surged by 7.4 points to 105.8-mark in December as against a rise of 98.4-level in November. Job Openings and Labor Turnover Summary (JOLTS) Job Openings grew to 5.52 mil- lion in November with respect to 5.45 million in October. Euro against dollar declined around 0.2 percent on Tuesday on account of strength in the dollar index along with weak global market sentiments. However, sharp downside was cushioned as a result of favourable economic data from the region. French Industrial Production jumped by 2.2 percent in November with respect to drop of 0.1 percent in October. The Sterling Pound rose around 0.12 percent in Tuesday’s trade as a result of weak global market sentiments coupled with stronger dollar. The Japanese Yen against dollar appreciated around 0.22 percent in Tuesday’s trading session due to rise in risk aversion in global market sentiments which led to increase in demand for the low yielding currency. Japan’s Consumer Confidence surged by 2.2 points to 43.1-mark in December as against a rise of 40.9-level in November. SEBI Certified – Research Analyst Equities I Commodities I Currencies I Mutual Funds Last PrevCl. PriceChng PriceChng% DollarIndex 101.99 101.85 0.14 0.14 USD/INR(Spot) 68.18 68.16 0.02 0.03 USD/INR(NseJan) 68.32 68.38 (0.06) (0.09) EUR/INR(Spot) 72.15 71.99 0.16 0.22 EUR/INR(NseJan) 72.35 72.00 0.35 0.48 GBP/INR(Spot) 82.83 82.90 (0.07) (0.08) GBP/INR(NseJan) 83.10 83.27 (0.17) (0.20) JPY/INR(NseJan) 58.96 58.56 0.40 0.68 MarketHighlights
- 2. Technical View: On daily chart, it has been observed that the JPYINR has completed a Bullish Bat harmonic pattern at 57.55 levels the coordinates of which are as follows: Technical Parameter: XA of the leg from 56 to 67.90,AB of the leg completed at 63.30 (i.e.38.20% of XA leg.), BC of the leg completed at 67.50 (i.e. near 88.60% of AB leg) and CD of the leg completed at 57.55 level. (i.e. 88% of XA and 224% of BC leg). On daily chart momentum indicator RSI is trading in oversold zone which indicates up side momentum can be seen in the prices. In addition, momentum indicator MACD has shown posi- tive crossover which suggest possibilities of rebound in the prices on daily chart. So for trading perspective, one could JPYINR buy in the range of 58.80 with SL of 58.50 for target of 59 .40 lev- els. Pivot levels for the Day Technical View: The pair has been moving in its rising channel pattern and prices have been taking support of its lower band of channel pattern at 67.90 levels on hourly chart. On hourly chart price has taken support of its 61.80% Fibonacci retracement levels. Moreover, prices have been trading above its 21 HSMA which gives the sign of bullishness in the prices. A momentum indicator RSI has been trading above 40 levels, which suggest further positive momentum can be seen in the prices. In addition, momentum indicator MACD has shown positive crossover on hourly chart. So for trading perspective, one could buy USDINR in range 68.20 with SL of 68 for target of 68.60. Currency Highlights 11th Jan’2017 USDINR JPYINR SEBI Certified – Research Analyst Equities I Commodities I Currencies I Mutual Funds S3 S2 S1 Pivot R1 R2 R3 USDINR 67.84 68.05 68.19 68.26 68.40 68.47 68.68 JPYINR 58.52 58.72 58.84 58.92 59.04 59.12 59.32
- 3. Pivot levels for the Day Currency Highlights 11th Jan’2017 GBPINR EURINR Technical View: The price has taken support of its horizontal trend line at 71.80 levels on daily chart. The EURINR pair has also taken support of its falling trend line at 70.70 levels on daily chart. The pair has been trading above its 21 DSMA on daily chart, which suggest further bullishness can be seen in the prices. On daily chart momentum oscillator RSI has been mov- ing above 50 levels on daily chart, which suggest bullish- ness in the prices. A momentum indicator MACD has shown positive cross- over on daily chart, which support our bullish view to the prices. For now we can expect prices should move higher to- wards 72.80 levels in the coming trading session. Technical View: The price has been trading in inverted head and shoul- der formation and prices ay test its neckline at 85 levels on hourly chart. The price have shown breakout its horizontal line at 84 levels on hourly chart. Moreover, prices have been trading above 21 HSMA, which suggest short term trend looks positive. Moreover, momentum indicator MACD has given posi- tive cross over on hourly chart, which gives the sign of bullishness in the prices. The momentum indictor RSI has been trading above 45 levels on hourly chart, which suggest the possibilities of further rebound in the prices. For now we expect prices should move higher towards 83.80 levels coming trading sessions. SEBI Certified – Research Analyst Equities I Commodities I Currencies I Mutual Funds S3 S2 S1 Pivot R1 R2 R3 GBPINR 82.07 82.53 82.81 82.99 83.27 83.45 83.91 EURINR 71.97 72.18 72.27 72.39 72.48 72.60 72.81
- 4. Currency Highlights SEBI Certified – Research Analyst Equities I Commodities I Currencies I Mutual Funds 11th Jan’2017 Economic Indicators Date Time Data Prior Expected Impact 11.01.17 03:00 AM Manufacturing Production m/m -0.9% 0.6% Actual > Forecast = Good for currency; GBPINR 11.01.17 09:00 AM Crude Oil Inventories -7.1M
- 5. Currency Highlights 11th Jan’2017 SEBI Certified – Research Analyst Equities I Commodities I Currencies I Mutual Funds Anish Vyas Digitally signed by Anish Vyas DN: cn=Anish Vyas, o=Choice Merchandise Broking Pvt. Ltd, ou=Sr. Research Associate, email=anish.vyas@choiceindia.com, c=IN Date: 2017.01.11 09:09:16 +05'30'