1. Currency Highlights
22nd
March’2017
HighLights:
Indian Rupee closed near 17-month high to 65.28 on Tuesday
US Current Account was at deficit of $112 billion in Q4 of 2016
UK’s Consumer Price Index (CPI) grew by 2.3 percent in February
Japan’s Trade Balance at a surplus of 0.68 trillion Yen in February
Indian Rupee continued to rise and close near to 17-month high and
appreciated around 8 paise to end at 65.28 against the US dollar on Tuesday.
The currency appreciated on account of selling of dollars from exporters and
banks. Further, inflow of foreign funds in equity and debt markets led to
positive movement in the currency.
So far this year, rupee gained 4.2% while foreign institutional investors have
bought $4.23 billion and $1.28 million from local equity and debt markets,
respectively. Traders are awaiting Fed chairwoman’s Janet Yellen’s speech on
Thursday for further cues.
Indian Rupee moved in the range of 65.21 to 65.44 in Tuesday’s trade. The
Reserve Bank of India (RBI) fixed reference rate for the dollar was seen at
65.3117 and Euro stood at 70.2950 as on 21st
Mar’17.
For the month of March 2017, FII inflows in equities totalled at Rs.19343.30 crores ($2914.08 million) as on 21st
March 2017. Year to date
basis, net capital inflows stood at Rs.28068.88 crores ($4216.52 million) as on 21st
March 2017.
US Dollar Index plunged around 0.62 percent in Tuesday’s trading session due to unfavourable economic data from the country. However,
sharp downside in the currency was prevented as a result of rise in risk aversion in global market sentiments which led to increase in de-
mand for the low yielding currency.
US Current Account was at deficit of $112 billion in Q4 of 2016 as against a deficit of $116 billion in previous quarter. The Conference Board
(CB) Leading Index gained by 1.2 percent in February from 0.9 percent in January.
Euro against dollar grew around 0.7 percent on Tuesday on account of weakness in the dollar. However, weak global market sentiments
capped sharp gains in the currency.
The Sterling Pound surged around 1 percent in Tuesday’s trade on account of weaker dollar coupled with favourable economic data from
the country. However, weak global market sentiments prevented sharp gains in the currency.
UK’s Consumer Price Index (CPI) grew by 2.3 percent in February as against a rise of 1.8 percent in January. Producer Price Index (PPI) Input
plunged by 0.4 percent in previous month from a gain of 1.6 percent in January. Public Sector Net Borrowing was at a surplus of 1.1 billion
Pounds in February when compared to a deficit of 11.7 billion Pounds a month ago. Retail Price Index (RPI) expanded by 3.2 percent in Feb-
ruary with respect to 2.6 percent in January. Confederation of British Industry (CBI) Industrial Order Expectations remained unchanged at 8-
mark in March.
The Japanese Yen against dollar appreciated around 0.75 percent in Tuesday’s trading session due to rise in risk aversion in global market
sentiments which led to increase in demand for the low yielding currency. Japan’s Trade Balance at a surplus of 0.68 trillion Yen in February
from a surplus of 0.20 trillion Yen in January.
SEBI Certified – Research Analyst Equities I Commodities I Currencies I Mutual Funds
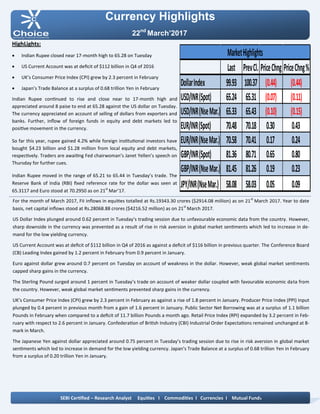
Last PrevCl. PriceChng PriceChng%
DollarIndex 99.93 100.37 (0.44) (0.44)
USD/INR(Spot) 65.24 65.31 (0.07) (0.11)
USD/INR(NseMar.) 65.33 65.43 (0.10) (0.15)
EUR/INR(Spot) 70.48 70.18 0.30 0.43
EUR/INR(NseMar.) 70.58 70.41 0.17 0.24
GBP/INR(Spot) 81.36 80.71 0.65 0.80
GBP/INR(NseMar.) 81.45 81.26 0.19 0.23
JPY/INR(NseMar.) 58.08 58.03 0.05 0.09
MarketHighlights
2. Technical View:
On a daily chart, the pair has been trading in horizontal
channel pattern from past few months and price has
taken the support of its horizontal channel pattern at
57.25 levels.
Moreover, prices have been trading above its 10 HSMA
which gives the sign of bullishness in the prices.
On a daily chart momentum indicator, RSI is taking
support at 30 levels which indicate pullback in the prices.
In addition, momentum indicator MACD has shown
positive crossover which suggests strength in the prices
on a daily chart.
So for trading perspective, one can buy JPYINR in the
range of 58 with SL of 57.70 for the target of 58.60
levels.
Pivot levels for the Day
Technical View:
The pair has given a breakdown of its “Symmetrical
Triangle” pattern at 66.60 levels on a daily chart.
Moreover, prices have been trading below its 50 DSMA
which gives the sign of bearishness in the prices.
Furthermore, the price has shown a breakdown of its
consolidation range from 67.40 to 66.60 levels on a daily
chart.
A momentum indicator RSI has remained below 45
levels, which suggest further negative momentum can
be seen in the prices.
In addition, momentum indicator MACD has shown
negative crossover and moving below its signal line on a
daily chart.
So for trading perspective, one can sell USDINR in the
range of 65.40 with SL of 65.60 for the target of 65
levels.
Currency Highlights
22nd
March’2017
USDINR JPYINR
SEBI Certified – Research Analyst Equities I Commodities I Currencies I Mutual Funds
S3 S2 S1 Pivot R1 R2 R3
USDINR 64.93 65.15 65.24 65.37 65.46 65.59 65.81
JPYINR 57.33 57.68 57.88 58.03 58.23 58.38 58.73
3. Pivot levels for the Day
Currency Highlights
22nd
March’2017
GBPINR EURINR
Technical View:
On a daily chart, prices have been trading in falling
channel pattern from past few weeks and price has
taken the support of its lower band of channel pattern
at 69.60 levels.
The price has taken the support of its falling trend line
at 69.50 levels o daily chart.
The pair has been trading above its 10 HSMA on the
hourly chart, which suggests further positive
momentum can be seen in the prices.
On a daily chart momentum oscillator, RSI has been
taking support at 35 levels on a daily chart, which
suggests bullishness in the prices.
A momentum indicator MACD has shown positive
crossover on the hourly chart, which supports our
bullish view on the prices.
For now, we can expect prices should move higher
towards 71.20 levels in the coming trading session.
Technical View:
The pair has been trading in “Falling Wedge” pattern
from past few weeks and price has taken the support of
its lower band of the pattern at 80 levels on a daily
chart.
Moreover, prices have been trading above 10 HSMA,
which suggest short term trend looks up.
Moreover, momentum indicator MACD has given
positive crossover on the hourly chart, which gives the
sign of bullishness in the prices.
A momentum indicator RSI has been trading near its
support levels on the daily chart, which suggests the
possibilities of further upside momentum in the prices.
For now, we expect prices should move higher
towards 82 levels in the coming trading sessions.
SEBI Certified – Research Analyst Equities I Commodities I Currencies I Mutual Funds
S3 S2 S1 Pivot R1 R2 R3
GBPINR 79.68 80.45 80.94 81.22 81.71 81.99 82.76
EURINR 69.98 70.25 70.41 70.52 70.68 70.79 71.06
4. Currency Highlights
SEBI Certified – Research Analyst Equities I Commodities I Currencies I Mutual Funds
22nd
March’2017
Economic Indicators
Date Time Data Prior Expected Impact
22.03.17 06:20 AM Trade Balance 0.16T 0.55T Actual > Forecast = Good for
currency; JPYINR
22.03.17 03:30 PM Current Account 31.0B 29.3B Actual > Forecast = Good for
currency; EURINR
22.03.17 08:30 PM Existing Home Sales 5.69M 5.59M Actual > Forecast = Good for
currency; USDINR
22.03.17 09:00 PM Crude Oil Inventories -0.2M
5. Currency Highlights
22nd
March’2017
SEBI Certified – Research Analyst Equities I Commodities I Currencies I Mutual Funds
Amit Pathania
Digitally signed by Amit Pathania
DN: cn=Amit Pathania, o=Choice Equity Broking Pvt. ltd,
ou=Research Department, email=amit.pathania@choiceindia.com,
c=IN
Date: 2017.03.22 08:45:26 +05'30'