1. Currency Highlights
18th
July’2016
HighLights:
India’s erased its gains and fell by 16 paise to 67.07 on Friday
US Retail Sales also expanded by 0.6 percent in the last month
Euro Zone Trade Balance at a surplus of 24.5 billion Euros in May
India’s Trade Balance at a deficit of $8.12 billion in previous month
US Prelim UoM Consumer Sentiment fell to 89.5-mark in July
Indian Rupee erased its two days gains and depreciated around 16 paise to
end at 67.07 against the US dollar on Friday. The currency depreciated on
fresh dollar demand from importers and banks. Additionally, plunge in do-
mestic market sentiments kept pressure on the currency.
However, sharp downside in the currency was cushioned as a result of
good inflow of foreign capital. Indian Rupee moved in the range of 66.83
to 67.1350 in Friday’s trading session. The currency had appreciated
around 27 paise or 0.4 percent in previous two trading sessions. The Re-
serve Bank of India (RBI) fixed reference rate for the dollar was seen at
67.0655 and Euro stood at 74.6037 in Friday’s trade.
In cross-currency trades, the rupee moved down against the pound sterling to finish at 89.78 from 89.51 on Friday and while
recouped against the euro to 74.65 from 74.72. The domestic currency fell against the Japanese yen to 63.34 per 100 yen as
against 63.30. India’s Trade Balance at a deficit of $8.12 billion in June from a previous deficit of $6.27 billion in May.
US Dollar Index surged around 0.5 percent in Friday‘s trading session due to rise in risk aversion in global market sentiments
which led to increase in demand for the low yielding currency. However, unfavourable economic data from the country
capped sharp gains in the currency. US Consumer Price Index (CPI) unchanged at 0.2 percent in the last month. Core CPI also
remained unchanged at 0.2 percent in June. Core Retail Sales grew by 0.7 percent in June as against a rise of 0.4 percent in
May. Retail Sales also expanded by 0.6 percent in last month from 0.2 percent in May. Empire State Manufacturing Index
plunged by 5.4 points to 0.6-mark in July when compared to 6-level in June. Capacity Utilization Rate rose by 75.4 percent in
June with respect to 74.9 percent in May. Industrial Production gained by 0.6 percent in June as compared to drop of 0.3 per-
cent a month ago. Prelim UoM Consumer Sentiment fell by 4 points to 89.5-mark in July from 93.5-level in previous month.
Euro against dollar plunged around 0.76 percent on Friday on account of weak global market sentiments. Further, strength in
the dollar index led to downside in the currency. However, sharp fall in the currency was prevented due to favourable eco-
nomic data from the region. Italian Trade Balance was at a surplus of 5.03 billion Euros in May as against a surplus of 4.51 bil-
lion Euros in April. Euro Zone Final CPI unchanged at 0.1 percent in the last month. Euro Zone Trade Balance at a surplus of
24.5 billion Euros in May from a previous surplus of 25.4 billion Euros a month ago.
The Sterling Pound dropped by more than 1 percent in Friday’s trade due to stronger dollar. Further, weak global market senti-
ments led to downside movement in the currency.
The Japanese Yen against dollar appreciated around 0.5 percent in Friday’s trading session due to rise in risk aversion in global
market sentiments which led to increase in demand for the low yielding currency.
SEBI Certified – Research Analyst Equities I Commodities I Currencies I Mutual Funds
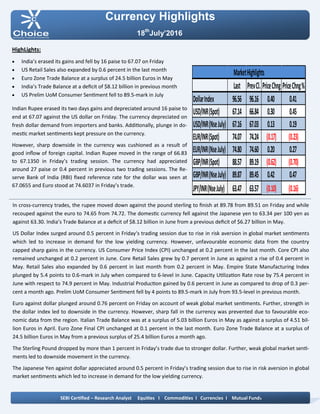
Last PrevCl. PriceChng PriceChng%
DollarIndex 96.56 96.16 0.40 0.41
USD/INR(Spot) 67.14 66.84 0.30 0.45
USD/INR(NseJuly) 67.16 67.03 0.13 0.19
EUR/INR(Spot) 74.07 74.24 (0.17) (0.23)
EUR/INR(NseJuly) 74.80 74.60 0.20 0.27
GBP/INR(Spot) 88.57 89.19 (0.62) (0.70)
GBP/INR(NseJuly) 89.87 89.45 0.42 0.47
JPY/INR(NseJuly) 63.47 63.57 (0.10) (0.16)
MarketHighlights
2. Technical View:
The pair have been taking support of its horizontal trend line
at 63.20 levels on daily chart. The pair has taken support of
rising trend line at 63 levels.
In addition, on daily chart prices have been trading above its
50 daily exponential moving average which gives the positive
confirmation to the prices.
Moreover, price has been taking support of its 61.80% Fibo-
nacci retracement levels t 63.20 levels on daily .
On daily chart, momentum oscillator RSI has moved above
40 levels, which gives positive confirmation to the prices.
A momentum indicator MACD has shown positive sign on
daily chart, which indicates short term trend remains bullish.
For now we expect prices to move higher towards 64.10 lev-
els in few trading sessions.
Pivot levels for the Day
Technical View:
The prices have been taking support of its rising trend line at
67 levels on daily chart. Price has formed bullish engulfing
pattern on daily chart.
Moreover, price have been trading above its 21 hourly expo-
nential moving average which suggest near term remains up.
So any dip in the prices towards 66.95 level, used as buying
opportunity.
A momentum indicator RSI has moved above 40 levels on
daily chart, which suggest bullishness in the prices.
A momentum indictor MACD has given positive crossover on
4 hourly chart, which gives negative confirmation to the pric-
es.
For now we expect prices to move higher towards 67.60 lev-
els in few trading sessions.
Currency Highlights
18th
July’2016
USDINR JPYINR
SEBI Certified – Research Analyst Equities I Commodities I Currencies I Mutual Funds
S3 S2 S1 Pivot R1 R2 R3
USDINR 66.55 66.83 66.99 67.11 67.27 67.39 67.67
JPYINR 62.04 62.72 63.09 63.40 63.77 64.08 64.76
3. Pivot levels for the Day
Currency Highlights
18th
July’2016
GBPINR EURINR
Technical View:
The price has been trading in falling channel pattern and
price has taken support of its lower band of pattern at 74.50
levels on daily chart.
The price has been taken support of its rising trend line at
74.60 levels on daily chart.
On the other hand, Pair has been trading above its 21 hourly
exponential moving average which indicates that trend is
remains up.
A momentum oscillator RSI have been trading above 40 lev-
els on daily chart which gives the signs of bullishness to the
prices.
Moreover, momentum indicator MACD has shown positive
crossover on daily chart which support our bullish view on
the pair.
For now we expect prices should move higher towards 75.30
levels in the coming trading sessions.
Technical View:
The price has formed bullish hammer candle stick pattern on
daily which is bullish pattern. Price has been falling trend
line at 89 levels on daily chart.
The pair has taken support of its horizontal trend line at
88.60 levels.
The price has completed bullish AB=CD harmonic pattern on
daily chart 87.20 levels.
A momentum indicator RSI has moved in oversold zone at
27 levels on daily chart, which suggest bullishness in the
prices.
Moreover, momentum indicator MACD has shown positive
sign on daily chart which support our bullish view on the
pair.
For now we expect prices should move higher towards 90.60
levels in the coming trading sessions.
SEBI Certified – Research Analyst Equities I Commodities I Currencies I Mutual Funds
S3 S2 S1 Pivot R1 R2 R3
GBPINR 88.51 89.22 89.54 89.93 90.25 90.64 91.35
EURINR 74.01 74.37 74.58 74.73 74.94 75.09 75.45
4. Currency Highlights
SEBI Certified – Research Analyst Equities I Commodities I Currencies I Mutual Funds
Economic Indicators
Date Time Data Prior Expected Impact
18.07.16 4:31am Rightmove HPI m/m 0.8% Actual > Forecast = Good for curren-
cy; GBPINR
18.07.16 7:30pm NAHB Housing Market Index 60 60 Actual > Forecast = Good for curren-
cy; USDINR
18th
July’2016
5. Currency Highlights
18th
July’2016
SEBI Certified – Research Analyst Equities I Commodities I Currencies I Mutual Funds
Amit Pathania
Digitally signed by Amit Pathania
DN: cn=Amit Pathania, o=Choice Equity Broking Pvt. ltd, ou=Research
Department, email=amit.pathania@choiceindia.com, c=IN
Date: 2016.07.18 08:42:00 +05'30'