1. Currency Highlights
09th
Jan’2017
HighLights:
Indian economy is likely to grow at 7.1 percent in 2016-17
US Non-Farm Employment Change plunged to 156,000 in Dec’16
German Factory Orders plunged by 2.5 percent in November
US Factory Orders dropped by 2.4 percent in month of November
Indian Rupee remained unchanged at 67.96 against the US dollar on Friday as
investors were cautious ahead of advance gross domestic product estimates
for fiscal year ending March along with employment and payroll data from
the US. However, outflow of foreign funds after selling of equities by institu-
tional investors along with weak domestic market sentiments capped gains in
the currency. So far this year, foreign institutional investors sold $232.40 mil-
lion in equity, while bought $29.1 million in debt. Indian Rupee moved in the
range of 67.80 to 68.05 in Friday’s trade. The Reserve Bank of India (RBI) fixed
reference rate for the dollar was seen at 67.9522 and Euro stood at 71.8662
as on 6th
Jan’17.
For the month of January 2017, FII outflows in equities totalled at Rs.2304.48
crores ($338.59 million) as on 6th
January 2017. Year to date basis, net capital
outflows stood at Rs.2304.48 crores ($338.59 million) as on 6th
January 2017.
According to government data, Indian economy is likely to grow at 7.1 percent in 2016-17, 0.5 percentage points slower than the previous
year’s expansion of 7.6 percent.
US Dollar Index gained around 0.7 percent in Friday’s trading session due to rise in risk aversion in global market sentiments in early part of
the trade which led to increase in demand for the low yielding currency. However, unfavourable economic data from the country capped
sharp gains in the currency.
US Average Hourly Earnings grew by 0.4 percent in December as against a decline of 0.1 percent in November. Non-Farm Employment
Change plunged by 48,000 to 156,000 in previous month from a rise of 204,000 in November. Unemployment Rate grew by 4.7 percent in
December with respect to 4.6 percent a month ago. Trade Balance was at a deficit of $45.2 billion in November when compared to previ-
ous deficit of $42.4 billion in earlier month. Factory Orders dropped by 2.4 percent in November as compared with gain of 2.8 percent in
October.
Euro against dollar dropped around 0.7 percent on Friday on account of strength in the dollar index. However, sharp upside was capped as
a result of unfavourable economic data from the region along with upbeat global market sentiments.
German Factory Orders plunged by 2.5 percent in November as against a rise of 5 percent in October. German Retail Sales dropped by 1.8
percent in November from a gain of 2.5 percent a month ago. French Trade Balance was at a deficit of 4.4 billion Euros in November with
respect to deficit of 5.2 billion Euros in October. Euro Zone Retail Sales fell by 0.4 percent in November when compared to increase of 1.4
percent in October.
The Sterling Pound declined by more than 1 percent in Friday’s trade as a result of stronger dollar. However, upbeat global market senti-
ments cushioned sharp fall in the currency.
The Japanese Yen against dollar depreciated by more than 1 percent in Friday’s trading session due to rise in risk appetite in global market
sentiments in later part of the trade which led to decline in demand for the low yielding currency.
SEBI Certified – Research Analyst Equities I Commodities I Currencies I Mutual Funds
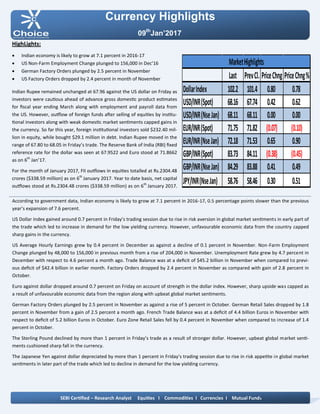
Last PrevCl. PriceChng PriceChng%
DollarIndex 102.2 101.4 0.80 0.78
USD/INR(Spot) 68.16 67.74 0.42 0.62
USD/INR(NseJan) 68.11 68.11 0.00 0.00
EUR/INR(Spot) 71.75 71.82 (0.07) (0.10)
EUR/INR(NseJan) 72.18 71.53 0.65 0.90
GBP/INR(Spot) 83.73 84.11 (0.38) (0.45)
GBP/INR(NseJan) 84.29 83.88 0.41 0.49
JPY/INR(NseJan) 58.76 58.46 0.30 0.51
MarketHighlights
2. Technical View:
On daily chart, it has been observed that the JPYINR has
completed a Bullish Bat harmonic pattern at 57.55 levels
the coordinates of which are as follows:
Technical Parameter: XA of the leg from 56 to 67.90,AB
of the leg completed at 63.30 (i.e.38.20% of XA leg.), BC
of the leg completed at 67.50 (i.e. near 88.60% of AB leg)
and CD of the leg completed at 57.55 level. (i.e. 88% of
XA and 224% of BC leg).
On daily chart momentum indicator RSI is trading in
oversold zone which indicates up side momentum can
be seen in the prices.
In addition, momentum indicator MACD has shown posi-
tive crossover which suggest possibilities of rebound in
the prices on daily chart.
So for trading perspective, one could JPYINR buy in the
range of 58.70 with SL of 58.40 for target of 59.20 levels.
Pivot levels for the Day
Technical View:
The pair has been moving in its rising channel pattern
and prices have been taking support of its lower band of
channel pattern at 67.90 levels on hourly chart.
On hourly chart price has taken support of its 61.80%
Fibonacci retracement levels.
Moreover, prices have been trading above its 21 HSMA
which gives the sign of bullishness in the prices.
A momentum indicator RSI has been trading above 40
levels, which suggest further positive momentum can be
seen in the prices.
In addition, momentum indicator MACD has shown
positive crossover on hourly chart.
So for trading perspective, one could buy USDINR in
range 68 with SL of 67.80 for target of 68.40.
Currency Highlights
09th
Jan’2017
USDINR JPYINR
SEBI Certified – Research Analyst Equities I Commodities I Currencies I Mutual Funds
S3 S2 S1 Pivot R1 R2 R3
USDINR 65.89 67.15 67.63 68.41 68.89 69.67 70.93
JPYINR 61.54 61.81 65.29 62.08 65.56 62.35 62.62
3. Pivot levels for the Day
Currency Highlights
09th
Jan’2017
GBPINR EURINR
Technical View:
The price has taken support of its horizontal trend line
at 71.80 levels on daily chart. The EURINR pair has also
taken support of its falling trend line at 70.70 levels on
daily chart.
The pair has been trading above its 21 DSMA on daily
chart, which suggest further bullishness can be seen in
the prices.
On daily chart momentum oscillator RSI has been mov-
ing above 50 levels on daily chart, which suggest bullish-
ness in the prices.
A momentum indicator MACD has shown positive cross-
over on daily chart, which support our bullish view to
the prices.
For now we can expect prices should move higher to-
wards 73 levels in the coming trading session.
Technical View:
The price has been trading in inverted head and shoul-
der formation and prices ay test its neckline at 85 levels
on hourly chart.
The price have shown breakout its horizontal line at 84
levels on hourly chart.
Moreover, prices have been trading above 21 HSMA,
which suggest short term trend looks positive.
Moreover, momentum indicator MACD has given posi-
tive cross over on hourly chart, which gives the sign of
bullishness in the prices.
The momentum indictor RSI has been trading above 45
levels on hourly chart, which suggest the possibilities of
further rebound in the prices.
For now we expect prices should move higher towards
85 levels coming trading sessions.
SEBI Certified – Research Analyst Equities I Commodities I Currencies I Mutual Funds
S3 S2 S1 Pivot R1 R2 R3
GBPINR 83.58 83.94 84.12 84.30 84.48 84.66 85.02
EURINR 71.13 71.51 71.52 71.89 71.90 72.27 72.65
4. Currency Highlights
SEBI Certified – Research Analyst Equities I Commodities I Currencies I Mutual Funds
09th
Jan’2017
Economic Indicators
Date Time Data Prior Expected Impact
09.01.17 12:30 PM German Trade Balance 20.5B 20.8B Actual > Forecast = Good for
currency; EURINR
09.01.17 03:30 PM Unemployment Rate 9.8% 9.8% Actual > Forecast = Good for
currency; EURINR
5. Currency Highlights
09th
Jan’2017
SEBI Certified – Research Analyst Equities I Commodities I Currencies I Mutual Funds
Amit Pathania
Digitally signed by Amit Pathania
DN: cn=Amit Pathania, o=Choice Equity Broking Pvt. ltd,
ou=Research Department, email=amit.pathania@choiceindia.com,
c=IN
Date: 2017.01.07 14:49:09 +05'30'