1. Currency Highlights
10th
Jan’2017
HighLights:
Indian Rupee dropped to one week low at 68.21 on Monday
Euro Zone Sentix Investor Confidence rose to 18.2-mark in Jan’17
UK’s Halifax HPI increased by 1.7 percent in previous month
China’s Consumer Price Index (CPI) fell to 2.1 percent in December
China’s Consumer Price Index (CPI) fell to 2.1 percent in December as against
a rise of 2.3 percent in November. Producer Price Index (PPI) grew by 5.5 per-
cent in December from 3.3 percent a month ago.
Indian Rupee came under pressure to drop to one week low and depreciated
around 25 paise to end at 68.21 against the US dollar on Monday. The cur-
rency depreciated on the pessimism on domestic markets following lower
economic growth projections last Friday.
Further, outflow of foreign funds after selling of equities by institutional in-
vestors along with weak domestic market sentiments led to negative move-
ment in the currency. So far this year, foreign institutional investors sold
$238.69 million in equity, and bought $139.84 million in debt.
Indian Rupee moved in the range of 68.084 to 68.295 in Monday’s trade.
The Reserve Bank of India (RBI) fixed reference rate for the dollar was seen at 68.1863 and Euro stood at 71.8206 as on 9th Jan’17.
For the month of January 2017, FII outflows in equities totalled at Rs.2622.98 crores ($385.46 million) as on 9th January 2017. Year to date
basis, net capital outflows stood at Rs.2622.98 crores ($385.46 million) as on 9th January 2017.
US Dollar Index dropped around 0.3 percent in Monday’s trading session due to estimates of unfavourable economic data from the country
in coming days. However, rise in risk aversion in global market sentiments which led to increase in demand for the low yielding currency
cushioned sharp negative movement in the dollar index.
Euro against dollar gained around 0.4 percent on Monday on account of weakness in the dollar index. However, sharp upside was capped
as a result of mixed economic data from the region along with weak global market sentiments.
German Industrial Production fell marginally to 0.4 percent in November as against a rise of 0.5 percent in October. German Trade Balance
was at a surplus of 21.7 billion Euros in November from a surplus of 20.6 billion Euros a month ago. Italian Monthly Unemployment Rate
rose to 11.9 percent in November with respect to gain of 11.8 percent in October. Euro Zone Sentix Investor Confidence jumped by 8.2
points to 18.2-mark in January when compared to 10-level in December. Euro Region Unemployment Rate unchanged at 9.8 percent in
November.
The Sterling Pound declined around 0.8 percent in Monday’s trade as a result of weak global market sentiments. However, weakness in the
dollar index along with favourable economic data from the country cushioned sharp fall in the currency.
UK’s Halifax House Price Index (HPI) increased by 1.7 percent in December from 0.6 percent in November.
The Japanese Yen against dollar appreciated around 1 percent in Monday’s trading session due to rise in risk aversion in global market sen-
timents which led to increase in demand for the low yielding currency.
SEBI Certified – Research Analyst Equities I Commodities I Currencies I Mutual Funds
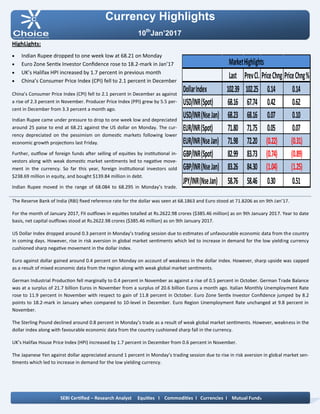
Last PrevCl. PriceChng PriceChng%
DollarIndex 102.39 102.25 0.14 0.14
USD/INR(Spot) 68.16 67.74 0.42 0.62
USD/INR(NseJan) 68.23 68.16 0.07 0.10
EUR/INR(Spot) 71.80 71.75 0.05 0.07
EUR/INR(NseJan) 71.98 72.20 (0.22) (0.31)
GBP/INR(Spot) 82.99 83.73 (0.74) (0.89)
GBP/INR(NseJan) 83.26 84.30 (1.04) (1.25)
JPY/INR(NseJan) 58.76 58.46 0.30 0.51
MarketHighlights
2. Technical View:
On daily chart, it has been observed that the JPYINR has
completed a Bullish Bat harmonic pattern at 57.55 levels
the coordinates of which are as follows:
Technical Parameter: XA of the leg from 56 to 67.90,AB
of the leg completed at 63.30 (i.e.38.20% of XA leg.), BC
of the leg completed at 67.50 (i.e. near 88.60% of AB leg)
and CD of the leg completed at 57.55 level. (i.e. 88% of
XA and 224% of BC leg).
On daily chart momentum indicator RSI is trading in
oversold zone which indicates up side momentum can
be seen in the prices.
In addition, momentum indicator MACD has shown posi-
tive crossover which suggest possibilities of rebound in
the prices on daily chart.
So for trading perspective, one could JPYINR buy in the
range of 58.40 with SL of 58.10 for target of 59 levels.
Pivot levels for the Day
Technical View:
The pair has been moving in its rising channel pattern
and prices have been taking support of its lower band of
channel pattern at 67.90 levels on hourly chart.
On hourly chart price has taken support of its 61.80%
Fibonacci retracement levels.
Moreover, prices have been trading above its 21 HSMA
which gives the sign of bullishness in the prices.
A momentum indicator RSI has been trading above 40
levels, which suggest further positive momentum can be
seen in the prices.
In addition, momentum indicator MACD has shown
positive crossover on hourly chart.
So for trading perspective, one could buy USDINR in
range 68.25 with SL of 68 for target of 68.80.
Currency Highlights
10th
Jan’2017
USDINR JPYINR
SEBI Certified – Research Analyst Equities I Commodities I Currencies I Mutual Funds
S3 S2 S1 Pivot R1 R2 R3
USDINR 67.91 68.12 68.26 68.33 68.47 68.54 68.75
JPYINR 57.81 58.13 58.35 58.45 58.67 58.77 59.09
3. Pivot levels for the Day
Currency Highlights
10th
Jan’2017
GBPINR EURINR
Technical View:
The price has taken support of its horizontal trend line
at 71.80 levels on daily chart. The EURINR pair has also
taken support of its falling trend line at 70.70 levels on
daily chart.
The pair has been trading above its 21 DSMA on daily
chart, which suggest further bullishness can be seen in
the prices.
On daily chart momentum oscillator RSI has been mov-
ing above 50 levels on daily chart, which suggest bullish-
ness in the prices.
A momentum indicator MACD has shown positive cross-
over on daily chart, which support our bullish view to
the prices.
For now we can expect prices should move higher to-
wards 72.60 levels in the coming trading session.
Technical View:
The price has been trading in inverted head and shoul-
der formation and prices ay test its neckline at 85 levels
on hourly chart.
The price have shown breakout its horizontal line at 84
levels on hourly chart.
Moreover, prices have been trading above 21 HSMA,
which suggest short term trend looks positive.
Moreover, momentum indicator MACD has given posi-
tive cross over on hourly chart, which gives the sign of
bullishness in the prices.
The momentum indictor RSI has been trading above 45
levels on hourly chart, which suggest the possibilities of
further rebound in the prices.
For now we expect prices should move higher towards
83.80 levels coming trading sessions.
SEBI Certified – Research Analyst Equities I Commodities I Currencies I Mutual Funds
S3 S2 S1 Pivot R1 R2 R3
GBPINR 81.14 82.31 82.78 83.48 83.95 84.65 85.82
EURINR 72.46 72.24 72.12 72.02 71.90 71.80 71.58
4. Currency Highlights
SEBI Certified – Research Analyst Equities I Commodities I Currencies I Mutual Funds
10th
Jan’2017
Economic Indicators
Date Time Data Prior Expected Impact
10.01.17 07:00 AM CPI y/y 2.3% 2.2% Actual > Forecast = Good for
currency; CNY
10.01.17 07:00 AM PPI y/y 3.3% 4.6% Actual > Forecast = Good for
currency; CNY
10.01.17 10:30 AM Consumer Confidence 40.9 41.3 Actual > Forecast = Good for
currency; JPYINR
10.01.17 08:30 PM JOLTS Job Openings 5.53M 5.59M Actual > Forecast = Good for
currency; USDINR
5. Currency Highlights
10th
Jan’2017
SEBI Certified – Research Analyst Equities I Commodities I Currencies I Mutual Funds
Anish Vyas
Digitally signed by Anish Vyas
DN: cn=Anish Vyas, o=Choice Merchandise
Broking Pvt. Ltd, ou=Sr. Research Associate,
email=anish.vyas@choiceindia.com, c=IN
Date: 2017.01.10 08:40:21 +05'30'