
Recommended
More Related Content
What's hot
What's hot (20)
Viewers also liked
Viewers also liked (20)
Similar to Currency high lights 13.01.17
Similar to Currency high lights 13.01.17 (20)
Recently uploaded
Recently uploaded (20)
Currency high lights 13.01.17
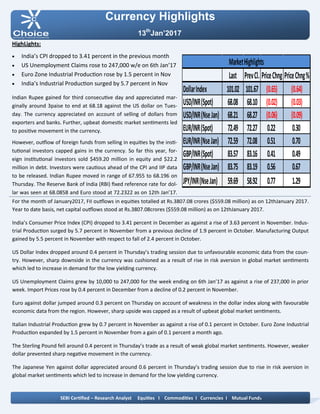
- 1. Currency Highlights 13th Jan’2017 HighLights: India’s CPI dropped to 3.41 percent in the previous month US Unemployment Claims rose to 247,000 w/e on 6th Jan’17 Euro Zone Industrial Production rose by 1.5 percent in Nov India’s Industrial Production surged by 5.7 percent in Nov Indian Rupee gained for third consecutive day and appreciated mar- ginally around 3paise to end at 68.18 against the US dollar on Tues- day. The currency appreciated on account of selling of dollars from exporters and banks. Further, upbeat domestic market sentiments led to positive movement in the currency. However, outflow of foreign funds from selling in equities by the insti- tutional investors capped gains in the currency. So far this year, for- eign institutional investors sold $459.20 million in equity and $22.2 million in debt. Investors were cautious ahead of the CPI and IIP data to be released. Indian Rupee moved in range of 67.955 to 68.196 on Thursday. The Reserve Bank of India (RBI) fixed reference rate for dol- lar was seen at 68.0858 and Euro stood at 72.2322 as on 12th Jan’17. For the month of January2017, FII outflows in equities totalled at Rs.3807.08 crores ($559.08 million) as on 12thJanuary 2017. Year to date basis, net capital outflows stood at Rs.3807.08crores ($559.08 million) as on 12thJanuary 2017. India’s Consumer Price Index (CPI) dropped to 3.41 percent in December as against a rise of 3.63 percent in November. Indus- trial Production surged by 5.7 percent in November from a previous decline of 1.9 percent in October. Manufacturing Output gained by 5.5 percent in November with respect to fall of 2.4 percent in October. US Dollar Index dropped around 0.4 percent in Thursday’s trading session due to unfavourable economic data from the coun- try. However, sharp downside in the currency was cushioned as a result of rise in risk aversion in global market sentiments which led to increase in demand for the low yielding currency. US Unemployment Claims grew by 10,000 to 247,000 for the week ending on 6th Jan’17 as against a rise of 237,000 in prior week. Import Prices rose by 0.4 percent in December from a decline of 0.2 percent in November. Euro against dollar jumped around 0.3 percent on Thursday on account of weakness in the dollar index along with favourable economic data from the region. However, sharp upside was capped as a result of upbeat global market sentiments. Italian Industrial Production grew by 0.7 percent in November as against a rise of 0.1 percent in October. Euro Zone Industrial Production expanded by 1.5 percent in November from a gain of 0.1 percent a month ago. The Sterling Pound fell around 0.4 percent in Thursday’s trade as a result of weak global market sentiments. However, weaker dollar prevented sharp negative movement in the currency. The Japanese Yen against dollar appreciated around 0.6 percent in Thursday’s trading session due to rise in risk aversion in global market sentiments which led to increase in demand for the low yielding currency. SEBI Certified – Research Analyst Equities I Commodities I Currencies I Mutual Funds Last PrevCl. PriceChng PriceChng% DollarIndex 101.02 101.67 (0.65) (0.64) USD/INR(Spot) 68.08 68.10 (0.02) (0.03) USD/INR(NseJan) 68.21 68.27 (0.06) (0.09) EUR/INR(Spot) 72.49 72.27 0.22 0.30 EUR/INR(NseJan) 72.59 72.08 0.51 0.70 GBP/INR(Spot) 83.57 83.16 0.41 0.49 GBP/INR(NseJan) 83.75 83.19 0.56 0.67 JPY/INR(NseJan) 59.69 58.92 0.77 1.29 MarketHighlights
- 2. Technical View: On daily chart, it has been observed that the JPYINR has completed a Bullish Bat harmonic pattern at 57.55 levels the coordinates of which are as follows: Technical Parameter: XA of the leg from 56 to 67.90,AB of the leg completed at 63.30 (i.e.38.20% of XA leg.), BC of the leg completed at 67.50 (i.e. near 88.60% of AB leg) and CD of the leg completed at 57.55 level. (i.e. 88% of XA and 224% of BC leg). On daily chart momentum indicator RSI is trading in oversold zone which indicates up side momentum can be seen in the prices. In addition, momentum indicator MACD has shown posi- tive crossover which suggest possibilities of rebound in the prices on daily chart. So for trading perspective, one could JPYINR buy in the range of 59.50 with SL of 59.20 for target of 60.10 levels. Pivot levels for the Day Technical View: The pair has been moving in its rising channel pattern and prices have been taking support of its lower band of channel pattern at 67.90 levels on hourly chart. On hourly chart price has taken support of its 61.80% Fibonacci retracement levels. Moreover, prices have been trading above its 21 HSMA which gives the sign of bullishness in the prices. A momentum indicator RSI has been trading above 40 levels, which suggest further positive momentum can be seen in the prices. In addition, momentum indicator MACD has shown positive crossover on hourly chart. So for trading perspective, one could buy USDINR in range 68.10 with SL of 67.90 for target of 68.50. Currency Highlights 13th Jan’2017 USDINR JPYINR SEBI Certified – Research Analyst Equities I Commodities I Currencies I Mutual Funds S3 S2 S1 Pivot R1 R2 R3 USDINR 67.76 67.97 68.08 68.18 68.29 68.39 68.60 JPYINR 58.96 59.31 59.51 59.66 59.86 60.01 60.36
- 3. Pivot levels for the Day Currency Highlights 13th Jan’2017 GBPINR EURINR Technical View: The price has taken support of its horizontal trend line at 71.80 levels on daily chart. The EURINR pair has also taken support of its falling trend line at 70.70 levels on daily chart. The pair has been trading above its 21 DSMA on daily chart, which suggest further bullishness can be seen in the prices. On daily chart momentum oscillator RSI has been mov- ing above 50 levels on daily chart, which suggest bullish- ness in the prices. A momentum indicator MACD has shown positive cross- over on daily chart, which support our bullish view to the prices. For now we can expect prices should move higher to- wards 73.10 levels in the coming trading session. Technical View: The price has been trading in inverted head and shoul- der formation and prices ay test its neckline at 85 levels on hourly chart. The price have shown breakout its horizontal line at 84 levels on hourly chart. Moreover, prices have been trading above 21 HSMA, which suggest short term trend looks positive. Moreover, momentum indicator MACD has given posi- tive cross over on hourly chart, which gives the sign of bullishness in the prices. The momentum indictor RSI has been trading above 45 levels on hourly chart, which suggest the possibilities of further rebound in the prices. For now we expect prices should move higher towards 84.30 levels coming trading sessions. SEBI Certified – Research Analyst Equities I Commodities I Currencies I Mutual Funds S3 S2 S1 Pivot R1 R2 R3 GBPINR 82.36 82.99 83.37 83.62 84.00 84.25 84.88 EURINR 71.87 72.19 72.41 72.51 72.73 72.83 73.15
- 4. Currency Highlights SEBI Certified – Research Analyst Equities I Commodities I Currencies I Mutual Funds 13th Jan’2017 Economic Indicators Date Time Data Prior Expected Impact 13.01.17 05:30 AM Fed Chair Yellen Speaks More hawkish than expected = Good for currency; USDINR 13.01.17 Tentative Trade Balance 298B 345B Actual > Forecast = Good for currency; CNY 13.01.17 07:00 PM Core Retail Sales m/m 0.2% 0.5% Actual > Forecast = Good for currency; USDINR 13.01.17 07:00 PM PPI m/m 0.4% 0.1% Actual > Forecast = Good for currency; USDINR 13.01.17 07:00 PM Retail Sales m/m 01.% 0.5% Actual > Forecast = Good for currency; USDINR 13.01.17 08:30 PM Prelim UoM Consumer Senti- ment 98.2 98.6 Actual > Forecast = Good for currency; USDINR
- 5. Currency Highlights 13th Jan’2017 SEBI Certified – Research Analyst Equities I Commodities I Currencies I Mutual Funds Anish Vyas Digitally signed by Anish Vyas DN: cn=Anish Vyas, o=Choice Merchandise Broking Pvt. Ltd, ou=Sr. Research Associate, email=anish.vyas@choiceindia.com, c=IN Date: 2017.01.13 09:03:34 +05'30'