Vip Call US 📞 7738631006 ✅Call Girls In Sakinaka ( Mumbai )
Currency high lights 12.07.16
1. Currency Highlights
12th
July’2016
HighLights:
Indian Rupee appreciated near three week high of 67.13 on Monday
US Labor Market Conditions Index plunged by 1.9-mark in June
Italian Industrial Production dropped by 0.6 percent in May
Japan’s Core Machinery Orders declined by 1.4 percent in May
Indian Rupee appreciated for third consecutive day and surged sharply by
24 paise to end at 67.13 against the US dollar on Monday. The currency
appreciated on account of selling of dollars from exporters and banks. Fur-
ther, sharp rise in the domestic market sentiments led to upside in the
currency.
However, sharp positive movement in the currency was capped due to
strength in the dollar index in early part of the trade. Indian Rupee moved
in the range of 67.06 to 67.22 in Monday’s trading session. The currency
has gained around 32 paise or 0.47 percent in last three trading session.
The Reserve Bank of India (RBI) fixed reference rate for the dollar was seen
at 67.1426 and Euro stood at 74.1053 in Monday’s trade.
In cross-currency trades, the rupee moved up further against the pound sterling to end at 87.19 from 87.41 on last Friday and
firmed up further against the euro to 74.20 from 74.55. The domestic currency recouped sharply against the Japanese yen to
65.57 per 100 yens from 67.08.
US Dollar Index gained around 0.26 percent in Monday‘s trading session due to favourable economic data from the country.
However, sharp upside in the currency was capped as a result of rise in risk appetite in global market sentiments which led to
decline in demand for the low yielding currency.
US Labor Market Conditions Index plunged by 1.9-mark in June as against a drop of 3.6-level a month ago.
Euro against dollar rose around 0.12 percent on Monday on account of upbeat global market sentiments. However, sharp up-
side in the currency was restricted due to strength in the dollar index along with unfavourable economic data from the region.
Italian Industrial Production dropped by 0.6 percent in May with respect to rise of 0.4 percent a month ago.
The Sterling Pound gained around 0.33 percent in Friday’s trade due to weaker dollar. Further, upbeat global market senti-
ments led to positive movement in the currency. However, sharp upside in the currency was capped as a result of unfavoura-
ble economic data from the countryalong with Britain exiting the Euro Zone leading to estimates that economy will go into
recession
The Japanese Yen against dollar appreciated around 0.2percentin Friday’s trading session due to rise in risk appetite in global
market sentiments on early part of the trade which led to increase in demand for the low yielding currency.
Japan’s Core Machinery Orders declined by 1.4 percent in May as against a drop of 11 percent in April. Prelim Machine Tool
Orders plunged by 19.9 percent in June from a fall of 24.7 percent in May.
SEBI Certified – Research Analyst Equities I Commodities I Currencies I Mutual Funds
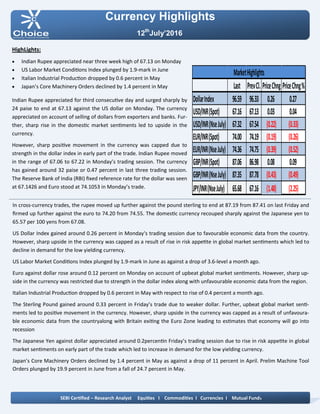
Last PrevCl. PriceChng PriceChng%
DollarIndex 96.59 96.33 0.26 0.27
USD/INR(Spot) 67.16 67.13 0.03 0.04
USD/INR(NseJuly) 67.32 67.54 (0.22) (0.33)
EUR/INR(Spot) 74.00 74.19 (0.19) (0.26)
EUR/INR(NseJuly) 74.36 74.75 (0.39) (0.52)
GBP/INR(Spot) 87.06 86.98 0.08 0.09
GBP/INR(NseJuly) 87.35 87.78 (0.43) (0.49)
JPY/INR(NseJuly) 65.68 67.16 (1.48) (2.25)
MarketHighlights
2. Technical View:
The pair have been trading in rising channel pattern and pric-
es have been facing resistance of its upper band of channel
pattern 67.60 levels on daily chart.
In addition, on daily chart prices have been trading below its
15 hourly exponential moving average which gives the nega-
tive confirmation to the prices.
On daily chart, momentum oscillator RSI has remained above
its overbought zone 70 levels, which gives negative confirma-
tion to the prices.
A momentum indicator MACD has shown negative sign on
daily chart, which indicates short term trend remains bearish.
For now we expect prices to move lower towards 66.10 levels
in few trading sessions.
Pivot levels for the Day
Technical View:
The price has been trading in its rising channel formation
from past few months and price has faced resistance of its
upper band at 68.10 levels on daily chart. Price has faced re-
sistance of its horizontal trend line at 68 levels on daily.
Moreover, price have been trading below its 15 daily expo-
nential moving average which suggest near term remains
down. So any rally in the prices towards 67.50 level, used as
selling opportunity.
A momentum indicator RSI has moved below 60 levels on
daily chart, which suggest bearishness in the prices.
A momentum indictor MACD has given negative crossover on
daily chart, which gives negative confirmation to the prices.
For now we expect prices to move lower towards 67 levels in
few trading sessions.
Currency Highlights
12th
July’2016
USDINR JPYINR
SEBI Certified – Research Analyst Equities I Commodities I Currencies I Mutual Funds
S3 S2 S1 Pivot R1 R2 R3
USDINR 66.98 67.14 67.22 67.30 67.38 67.46 67.62
JPYINR 63.59 64.83 65.25 66.07 66.49 67.31 68.55
3. Pivot levels for the Day
Currency Highlights
12th
July’2016
GBPINR EURINR
Technical View:
The price has shown breakout of its symmetrical triangle
patter at 75.50 levels on daily chart. The price has shown
breakdown of its rising channel pattern at 75.50 levels on
daily chart.
On the other hand, Pair has been trading below its 21 daily
exponential moving average which indicates that trend is
remains down.
A momentum oscillator RSI have been trading below 45 lev-
els on daily chart which gives the signs of bearishness to the
prices.
Moreover, momentum indicator MACD has shown negative
crossover on daily chart which support our bearish view on
the pair.
For now we expect prices should move lower towards 73.80
levels in the coming trading sessions.
Technical View:
The price has completed bullish AB=CD harmonic pattern on
daily chart 87.20 levels the coordinates of which are as fol-
lows: Technical Parameter: AB of the leg from 106 to 92,BC
of the leg completed 101 at (i.e.50% of AB leg.) CD of the leg
completed to 87.20 levels (i.e. near 200% Fibonacci Projec-
tion of BC leg). So any dips in the prices towards 87.50 level,
used as buying opportunity.
The price has taken support of its falling trend line at 87.30
levels on daily chart.
A momentum indicator RSI has moved in oversold zone at
27 levels on daily chart, which suggest bullishness in the
prices.
Moreover, momentum indicator MACD has shown positive
sign on daily chart which support our bullish view on the
pair.
SEBI Certified – Research Analyst Equities I Commodities I Currencies I Mutual Funds
S3 S2 S1 Pivot R1 R2 R3
GBPINR 85.41 86.30 86.83 87.19 87.72 88.08 88.97
EURINR 73.87 74.09 74.22 74.31 74.44 74.53 74.75
4. Currency Highlights
SEBI Certified – Research Analyst Equities I Commodities I Currencies I Mutual Funds
Economic Indicators
Date Time Data Prior Expected Impact
12.07.16 7:05pm FOMC Member Bullard Speaks
12.07.16 7:30pm JOLTS Job Openings 5.79M 5.74M Actual>Forcast=Good for Cur-
rency ;USDINR
12th
July’2016
5. Currency Highlights
12th
July’2016
SEBI Certified – Research Analyst Equities I Commodities I Currencies I Mutual Funds
Amit Pathania
Digitally signed by Amit Pathania
DN: cn=Amit Pathania, o=Choice Equity Broking Pvt. ltd, ou=Research
Department, email=amit.pathania@choiceindia.com, c=IN
Date: 2016.07.12 08:37:04 +05'30'