WhatsApp 📞 Call : 9892124323 ✅Call Girls In Chembur ( Mumbai ) secure service
Currency high lights 10.05.16
1. Currency Highlights
10th
May’2016
HighLights:
Indian Rupee fell marginally and ended at 66.58 on Monday
China’s CPI remained unchanged at 2.3 percent in the last month
German Factory Orders expanded by 1.9 percent in the month of
March
UK’s Halifax House Price Index (HPI) plunged by 0.8 percent in April
Euro Zone Sentix Investor Confidence rose to 6.2-mark in May
China’s Consumer Price Index (CPI) remained unchanged at 2.3 percent in
the month of April. Producer Price Index (PPI) plunged by 3.4 percent in
last month from a previous fall of 4.3 percent in March. Indian Rupee fell
marginally and declined around 4 paise to end at 66.58 against the US dol-
lar on Friday. The currency had depreciated on account of fresh demand
for dollars from importers and banks. However, sharp downside move-
ment in the currency was cushioned due to recovery in domestic market
sentiments. Indian Rupee moved in the range of 66.39 to 66.58 in Mon-
day’s trading session. The Reserve Bank of India (RBI) reference rate for
dollar was seen at 66.43 and Euro stood at 75.80 on Monday.
US Dollar Index gained around 0.3 percent in Monday’s trading session due to rise in risk aversion in global market sentiments
which led to increase in demand for the low yielding currency. However, unfavourable economic data from the country
capped sharp gains in the currency.
US Labor Market Conditions Index was at negative 0.9-mark in April as against a drop of 2.1-level in March.
Euro against dollar fell marginally on Monday on account of strength in the dollar index. Further, weak global market senti-
ments led to downside movement in the currency. However, sharp fall in the currency was prevented due to favourable eco-
nomic data from the region.
German Factory Orders expanded by 1.9 percent in March as against a decline of 0.8 percent a month ago. Euro Zone Sentix
Investor Confidence rose by 0.5 points to 6.2-mark in May with respect to 5.7- level in April.
The Sterling Pound against dollar dropped around 0.1 percent in Monday’s trade on account of strength in the dollar index.
Further, weak global market sentiments coupled with unfavourable economic data from the country led to negative move-
ment in the currency.
UK’s Halifax House Price Index (HPI) plunged by 0.8 percent in April from a previous rise of 2.2 percent in March.
The Japanese Yen against dollar depreciated around 0.94 percent in yesterday’s trade due to rise in risk appetite in global mar-
ket sentiments in early part of the trade which led to decline in demand for the low yielding currency.
Japan’s Consumer Confidence declined by 0.9 points to 40.8-mark in April as against a rise of 41.7-level in March.
SEBI Certified – Research Analyst Equities I Commodities I Currencies I Mutual Funds
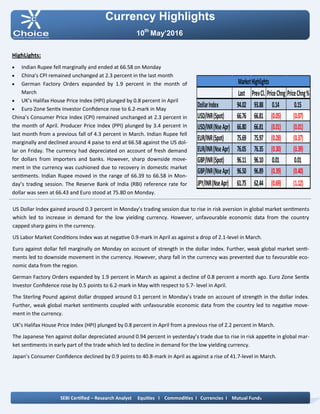
Last PrevCl. PriceChng PriceChng%
DollarIndex 94.02 93.88 0.14 0.15
USD/INR(Spot) 66.76 66.81 (0.05) (0.07)
USD/INR(NseApr) 66.80 66.81 (0.01) (0.01)
EUR/INR(Spot) 75.69 75.97 (0.28) (0.37)
EUR/INR(NseApr) 76.05 76.35 (0.30) (0.39)
GBP/INR(Spot) 96.11 96.10 0.01 0.01
GBP/INR(NseApr) 96.50 96.89 (0.39) (0.40)
JPY/INR(NseApr) 61.75 62.44 (0.69) (1.12)
MarketHighlights
2. Technical View:
The JPYINR price has been trading in rising wedge formation
form past few weeks. Price has faced strong resistance of up-
per band of wedge pattern at 63 levels on daily chart. Prices
have been facing resistance of falling trend line at 62.60 levels
on hourly chart.
Moreover, Pair has been trading below its 50 hourly exponen-
tial moving average which suggest short term trend remains
down.
On daily chart, momentum oscillator RSI has faced resistance
of horizontal trend line at 62 levels which suggest more selling
opportunity can be seen on higher side.
A momentum indicator MACD has shown negative sign on
daily chart, which indicates short term trend remains nega-
tive.
Pivot levels for the Day
Technical View:
The pair has formed long bearish candle with positive vol-
umes on daily chart. The USDINR price has given breakdown
of its rising trend line at 66.90 levels on hourly chart. Moreo-
ver, price has been moving in rectangle pattern and facing
resistance at 67 levels on daily chart.
On daily chart, USDINR has formed bearish doji candle stick
pattern which is bearish reversal pattern. Moreover, price
have been trading below its 50 daily exponential moving av-
erage so any rally towards 66.90 level, it would become the
best selling opportunity in near term.
A momentum indicator RSI has been trading below 50 levels
on hourly chart, which suggest bearishness in the prices.
Momentum indictor MACD has shown negative signs and
trading below single line on daily chart, which gives negative
confirmation to the prices.
For now we expect prices to move lower towards 66.30 lev-
els in few trading sessions.
Currency Highlights
10th
May’2016
USDINR JPYINR
SEBI Certified – Research Analyst Equities I Commodities I Currencies I Mutual Funds
S3 S2 S1 Pivot R1 R2 R3
USDINR 66.37 66.55 66.66 66.73 66.84 66.91 67.09
JPYINR 60.72 61.32 61.53 61.92 62.13 62.52 63.12
3. Pivot levels for the Day
Currency Highlights
10th
May’2016
GBPINR EURINR
Technical View:
Price has been trading in symmetrical triangle pattern on dai-
ly chart and facing resistance of its upper band at 76.90 lev-
els. The pair has faced strong resistance of its falling trend
line at 77 levels. The price has been trading in rising channel
formation and facing resistance of upper band of channel
pattern at 77.50 levels. Price has given breakdown its sym-
metrical pattern at 76.60 levels on hourly chart. On the other
hand, Pair has been trading below its 50 hourly exponential
moving average which indicates that trend is remains down.
A momentum oscillator RSI have been trading below 60 lev-
els on daily chart which gives bearishness to the prices.
Moreover, momentum indicator MACD has shown negative
crossover on four hourly chart which support our bearish
view on the pair.
Technical View:
The price has been trading in falling channel pattern and fac-
ing resistance of upper band of channel pattern at 98 levels
on daily chart. Moreover, price has formed the evening star
candle stick pattern with confirmation on daily chart.
on the other hand, Pair has been trading below its 100 daily
exponential moving average which indicates that trend is
remains down.
On hourly chart, GBPINR has given breakdown of its falling
channel pattern at 96.80 levels . A momentum oscillator RSI
have been trading below 60 levels on daily chart which gives
bearishness to the prices.
Moreover, momentum indicator MACD has shown negative
crossover on daily chart which support our bullish view on
the pair.
SEBI Certified – Research Analyst Equities I Commodities I Currencies I Mutual Funds
S3 S2 S1 Pivot R1 R2 R3
GBPINR 95.15 95.76 96.18 96.37 96.79 96.98 97.59
EURINR 75.63 75.84 75.94 76.05 76.15 76.26 76.47
4. Currency Highlights
SEBI Certified – Research Analyst Equities I Commodities I Currencies I Mutual Funds
Economic Indicators
Date Time Data Prior Expected Impact
10.05.16 7:00am CPI y/y 2.3% 2.3% Actual > Forecast = Good for
currency; Yuan
10.05.16 7:00am PPI y/y -4.3% -3.8% Actual > Forecast = Good for
currency; Yuan
10.05.16 12:45pm FOMC Member Dudley Speaks
10.05.16 2:00pm Goods Trade Balance -12.0B -11.2B Actual > Forecast = Good for
currency; GBPINR
10.05.16 7:30pm JOLTS Job Openings 5.45M 5.55M Actual > Forecast = Good for
currency; USDINR
10.05.16 10th-12th Mortgage Delinquencies 4.77% Actual > Forecast = Good for
currency; USDINR
10th
May’2016
5. Currency Highlights
10th
May’2016
SEBI Certified – Research Analyst Equities I Commodities I Currencies I Mutual Funds
Amit Pathania
Digitally signed by Amit Pathania
DN: cn=Amit Pathania, o=Choice Equity Broking Pvt. ltd, ou=Research
Department, email=amit.pathania@choiceindia.com, c=IN
Date: 2016.05.10 08:44:11 +05'30'