1. Currency Highlights
05th
Jan’2017
HighLights:
India’s Nikkei Services PMI grew marginally to 46.8-mark in Dec’16
Spanish Unemployment Change plunged by 86,800 in December
UK’s Construction PMI surged to 54.2-mark in previous month
Euro Zone CPI Flash Estimate jumped to 1.1 percent in December
Indian Rupee recovered from its low, the most gains since 6th Dec’16 and
appreciated around 28 paise to end at 68.05 against the US dollar on
Wednesday. The currency appreciated on account of selling of dollars from
exporters and banks.
However, outflow of foreign funds after selling of equities by institutional
investors along with weak domestic market sentiments capped gains in the
currency. So far this fiscal year, foreign institutional investors bought $1.69
billion in equity, while they sold $5.72 billion in debt.
Indian Rupee moved in the range of 67.840 to 68.300 in Wednesday’s trade.
The Reserve Bank of India (RBI) fixed reference rate for the dollar was seen at
68.1791 and Euro stood at 70.9949 as on 4th Jan’17. India’s Nikkei Services
Purchasing Managers' Index (PMI) grew marginally to 46.8-mark in December
from 46.7-level in November.
For the month of January 2017, FII outflows in equities totalled at Rs.1579.68 crores ($232.25 million) as on 4th January 2017. Year to date
basis, net capital outflows stood at Rs.1579.68 crores ($232.25 million) as on 4th January 2017.
US Dollar Index dropped around 0.5 percent in Wednesday’s trading session due to rise in risk appetite in global market sentiments which
led to decline in demand for the low yielding currency. However, sharp downside was prevented as Fed minutes hinted towards gradual
hike of interest rates in the current year.
Euro against dollar gained around 0.8 percent on Wednesday on account of weakness in the dollar index along with upbeat global market
sentiments. However, sharp upside was capped as a result of mixed economic data from the region.
Spanish Unemployment Change plunged by 86,800 in December as against a rise of 24,800 in November. Spanish Services PMI fell margin-
ally to 55-mark in December from 55.1-level in November. Italian Services PMI dropped by 1 point to 52.3-level in previous month when
compared to 53.3-mark in November. French Final Services PMI expanded to 52.9-mark in December with respect to 52.6-level a month
ago. German Final Services PMI rose by 0.5 points to 54.3-level in December as compared to 53.8-mark in November. Euro Zone Final Ser-
vices PMI gained by 0.6 points to 53.7-mark in December from 53.1-level a month earlier. Euro Zone Consumer Price Index (CPI) Flash Esti-
mate jumped to 1.1 percent in December as against a rise of 0.6 percent in November. Euro region Core CPI Flash Estimate gained margin-
ally to 0.9 percent in prior month with respect to 0.8 percent in November.
The Sterling Pound rose around 0.7 percent in Wednesday’s trade as a result of weaker dollar coupled upbeat global market sentiments.
Moreover, optimistic economic data from the country kept the currency in positive territory.
UK’s Construction Purchasing Managers' Index (PMI) surged by 1.4 points to 54.2-mark in December as against a rise of 52.8-level in No-
vember. Net Lending to Individuals grew by 5.1 billion in November from 4.9 billion a month ago.
The Japanese Yen against dollar appreciated around 0.4 percent in Wednesday’s trading session due to rise in risk appetite in global market
sentiments in early part of the trade which led to decline in demand for the low yielding currency.
SEBI Certified – Research Analyst Equities I Commodities I Currencies I Mutual Funds
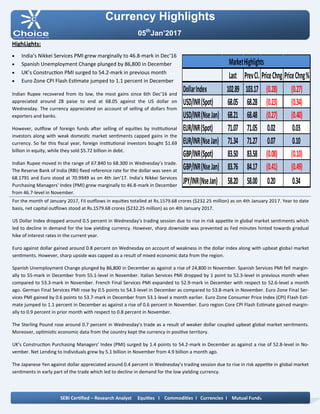
Last PrevCl. PriceChng PriceChng%
DollarIndex 102.89 103.17 (0.28) (0.27)
USD/INR(Spot) 68.05 68.28 (0.23) (0.34)
USD/INR(NseJan) 68.21 68.48 (0.27) (0.40)
EUR/INR(Spot) 71.07 71.05 0.02 0.03
EUR/INR(NseJan) 71.34 71.27 0.07 0.10
GBP/INR(Spot) 83.50 83.58 (0.08) (0.10)
GBP/INR(NseJan) 83.76 84.17 (0.41) (0.49)
JPY/INR(NseJan) 58.20 58.00 0.20 0.34
MarketHighlights
2. Technical View:
On daily chart, it has been observed that the JPYINR has
completed a Bullish Bat harmonic pattern at 57.55 levels
the coordinates of which are as follows:
Technical Parameter: XA of the leg from 56 to 67.90,AB
of the leg completed at 63.30 (i.e.38.20% of XA leg.), BC
of the leg completed at 67.50 (i.e. near 88.60% of AB leg)
and CD of the leg completed at 57.55 level. (i.e. 88% of
XA and 224% of BC leg).
On daily chart momentum indicator RSI is trading in
oversold zone which indicates up side momentum can
be seen in the prices.
In addition, momentum indicator MACD has shown posi-
tive crossover which suggest possibilities of rebound in
the prices on daily chart.
So for trading perspective, one could JPYINR buy in the
range of 58.05 with SL of 57.75 for target of 58.65 levels.
Pivot levels for the Day
Technical View:
The pair has shown breakout of its horizontal channel
at 67.50 levels on daily chart and price has retested its
breakout trend line at 67.40 levels.
On daily chart price has taken support of its 61.80% Fib-
onacci retracement levels.
Moreover, prices have been trading above its 50 DEMA
which gives the sign of bullishness in the prices.
A momentum indicator RSI has been trading above 40
levels, which suggest further positive momentum can be
seen in the prices.
In addition, momentum indicator MACD has shown
positive crossover on hourly chart.
So for trading perspective, one could buy USDINR in
range 68.20 with SL of 68 for target of 68.60.
Currency Highlights
05th
Jan’2017
USDINR JPYINR
SEBI Certified – Research Analyst Equities I Commodities I Currencies I Mutual Funds
S3 S2 S1 Pivot R1 R2 R3
USDINR 67.82 68.05 68.12 68.28 68.35 68.51 68.74
JPYINR 57.56 57.85 58.03 58.14 58.32 58.43 58.72
3. Pivot levels for the Day
Currency Highlights
05th
Jan’2017
GBPINR EURINR
Technical View:
The price has taken support of its horizontal trend line
at 70.60 levels on daily chart. The EURINR pair has also
taken support of its falling trend line at 70.70 levels on
daily chart.
The pair has been trading above its 15 HEMA on hourly
chart, which suggest further bullishness can be seen in
the prices.
On daily chart momentum oscillator RSI has moved up
form its oversold zone, which suggest bullishness in the
prices.
A momentum indicator MACD has shown positive cross-
over on 4 hourly chart, which support our bullish view
to the prices.
For now we can expect prices should move higher to-
wards 72 levels in the coming trading session.
Technical View:
The price has shown breakdown of its rising channel
pattern at 85 levels on daily chart. The pair has been
facing resistance of its falling trend line at 86.10 levels
on daily chart. The prices have been facing resistance of
its horizontal line at 86 levels.
Moreover, prices have been trading below 50 DEMA,
which suggest short term trend looks negative.
Moreover, momentum indicator MACD has given nega-
tive cross over on daily chart, which gives the sign of
bearishness in the prices.
The momentum indictor RSI has been trading below 60
levels on daily chart, which suggest the possibilities of
further weakness in the prices.
For now we expect prices should move lower towards
83.10 levels coming trading sessions.
SEBI Certified – Research Analyst Equities I Commodities I Currencies I Mutual Funds
S3 S2 S1 Pivot R1 R2 R3
GBPINR 83.37 83.59 83.67 83.81 83.89 84.03 84.25
EURINR 70.87 71.10 71.23 71.33 71.46 71.56 71.79
4. Currency Highlights
SEBI Certified – Research Analyst Equities I Commodities I Currencies I Mutual Funds
05th
Jan’2017
Economic Indicators
Date Time Data Prior Expected Impact
05.01.17 12:30 AM FOMC Meeting Minutes More hawkish than expected =
Good for currency; USDINR
05.01.17 03:00 PM Services PMI 55.2 54.8 Actual > Forecast = Good for
currency; GBPINR
05.01.17 06:45 PM ADP Non-Farm Employment
Change
216K 171K Actual > Forecast = Good for
currency; USDINR
05.01.17 07:00 PM Unemployment Claims 265K 262K Actual < Forecast = Good for
currency; USDINR
05.01.17 08:30 PM ISM Non-Manufacturing PMI 57.2 56.6 Actual > Forecast = Good for
currency; USDINR
05.01.17 09:30 PM Crude Oil Inventories 0.6M -1.8M
5. Currency Highlights
05th
Jan’2017
SEBI Certified – Research Analyst Equities I Commodities I Currencies I Mutual Funds
Anish Vyas
Digitally signed by Anish Vyas
DN: cn=Anish Vyas, o=Choice Merchandise
Broking Pvt. Ltd, ou=Sr. Research Associate,
email=anish.vyas@choiceindia.com, c=IN
Date: 2017.01.05 08:55:04 +05'30'