1. Currency Highlights
26th
Aug’2016
HighLights:
Indian Rupee erased its gains to 67.11 in Wednesday’s trading
session
Existing Home Sales declined to 5.39 million in the month of
July
German Final GDP remained unchanged at 0.4 percent in Q2
of 2016
UK’s BBA Mortgage Approvals dropped by 2,100 to 37,700 in
July
Indian Rupee erased its gains and depreciated around 5 paise to
end at 67.11 against the US dollar on Wednesday. The currency
depreciated on account of dollar demand from bankers and im-
porters. However, upside in domestic market sentiments cush-
ioned sharp upside in the currency. Indian Rupee moved in the
range of 67.0850 to 67.16 in Wednesday’s trading session.
In cross-currency trades, the rupee dropped further against the pound sterling and finished at 88.80 from 88.42, while it recov-
ered against the euro to end at 75.59 as compared to 76.05 on Tuesday. But, the home unit ended virtually steady against the
Japanese yen 66.97 per 100 yens.
US Dollar Index gained around 0.3 percent in Wednesday’s trading session due to rise in risk aversion in global market senti-
ments which led to increase in demand for the low yielding currency. However, unfavourable economic data from the country
capped sharp positive movement in the currency.
US House Price Index (HPI) unchanged at 0.2 percent in the month of June. Existing Home Sales declined to 5.39 million in July
as against a rise of 5.57 million a month ago.
Euro against dollar declined around 0.4 percent on Wednesday on account of strength in the dollar index. Further, unfavoura-
ble economic data from the region led to downside movement in the currency. Moreover, weak global market sentiments con-
tinued with negative movement in the currency.
German Final Gross Domestic Product (GDP) remained unchanged at 0.4 percent in Q2 of 2016. Belgian National Bank of Bel-
gium (NBB) Business Climate was at negative 3.1-mark in August from a rise of 1-level in July.
The Sterling Pound jumped around 0.3 percent in Wednesday’s trade as a result of stronger-than-expected economic data
after Britain's vote to leave the European Union has helped temper expectations of further Bank of England monetary easing.
However, strength in the dollar index coupled with weak global market sentiments capped sharp upside movement in the cur-
rency.
UK’s British Bankers' Association (BBA) Mortgage Approvals dropped by 2,100 to 37,700 in July as against a rise of 39,800 a
month ago.
SEBI Certified – Research Analyst Equities I Commodities I Currencies I Mutual Funds
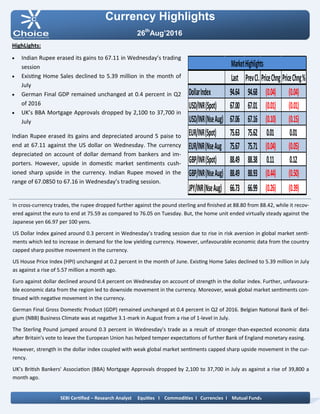
Last PrevCl. PriceChng PriceChng%
DollarIndex 94.64 94.68 (0.04) (0.04)
USD/INR(Spot) 67.00 67.01 (0.01) (0.01)
USD/INR(NseAug) 67.06 67.16 (0.10) (0.15)
EUR/INR(Spot) 75.63 75.62 0.01 0.01
EUR/INR(NseAug 75.67 75.71 (0.04) (0.05)
GBP/INR(Spot) 88.49 88.38 0.11 0.12
GBP/INR(NseAug) 88.49 88.93 (0.44) (0.50)
JPY/INR(NseAug) 66.73 66.99 (0.26) (0.39)
MarketHighlights
2. Technical View:
The prices have been trading in falling channel pattern and
prices have been facing resistance of upper band of channel
pattern 67 levels on daily chart.
The pair has faced résistance of horizontal trend line at 67.05
levels on daily chart.
Moreover, prices have been trading below its 21 HEMA on
hourly chart, which indicates short term trend remains down.
On daily chart, momentum oscillator RSI has faced resistance
at 65 levels, which gives negative confirmation to the prices.
A momentum indicator MACD has shown negative sign on
daily hourly chart, which indicates further bearishness in the
prices.
For now we expect prices to move lower towards 66.20 levels
in few trading sessions.
Pivot levels for the Day
Technical View:
The price has given breakdown of its rising channel pattern at
67.20 levels and price has retested the lower trend line 67.17
levels on daily chart. On the other hand prices have been fac-
ing resistance of horizontal trend line at 67.20 levels on daily
chart.
Moreover, price have been trading below its 50 daily expo-
nential moving average which suggest short term trend is
bearish. So any rally in the prices towards 67.20 level, used as
selling opportunity.
A momentum indicator RSI has remained below 60 levels on
daily chart, which suggest bearishness in the prices.
A momentum indictor MACD has given negative crossover
on daily chart, which gives negative confirmation to the pric-
es.
For now we expect prices to move lower towards 66.85 lev-
els in few trading sessions.
Currency Highlights
26th
Aug’2016
USDINR JPYINR
SEBI Certified – Research Analyst Equities I Commodities I Currencies I Mutual Funds
S3 S2 S1 Pivot R1 R2 R3
USDINR 66.88 66.99 67.08 67.10 67.19 67.21 67.32
JPYINR 66.36 66.56 66.65 66.76 66.85 66.96 67.16
3. Pivot levels for the Day
Currency Highlights
26th
Aug’2016
GBPINR EURINR
Technical View:
The prices have been trading in descending triangle pattern
from past few weeks and prices has faced resistance of its
upper band of triangle pattern at 76 levels on daily chart.
On the other hand, Pair has been trading below its 21 hourly
exponential moving average which indicates that trend is
turned into bearish.
A momentum oscillator RSI have been trading below 60 lev-
els on daily chart which gives the signs of bearish to the pric-
es.
Moreover, momentum indicator MACD has shown negative
sign on daily chart which support our bearish view on the
pair.
For now we expect prices should move lower towards 74.60
levels in the coming trading sessions.
Technical View:
The price has been trading in descending triangle formation
from past weeks and prices have been facing resistance of its
upper bad of triangle at 88.20 levels on daily chart. Any
movement can be if prices shown breakout above falling tre
nd line at 89 levels.
The prices have been trading below its 21 DEMA, which sug-
gest short term trend is down.
A momentum indicator RSI has remained below 50 levels on
daily chart, which suggest bearishness in the prices.
Moreover, momentum indicator MACD has shown negative
sign on daily chart which support our bearish view on the
pair.
For now we expect prices should move lower towards 89.60
levels in the coming trading sessions.
SEBI Certified – Research Analyst Equities I Commodities I Currencies I Mutual Funds
S3 S2 S1 Pivot R1 R2 R3
GBPINR 87.86 88.22 88.35 88.58 88.71 88.94 89.30
EURINR 75.30 75.47 75.57 75.64 75.74 75.81 75.98
4. Currency Highlights
SEBI Certified – Research Analyst Equities I Commodities I Currencies I Mutual Funds
Economic Indicators
Date Time Data Prior Expected Impact
26.08.16 6:00PM Prelim GDP q/q 1.2% 1.1% Actual > Forecast = Good
for currency; USDINR
26.08.16 6:00 PM Goods Trade Balance -63.3B -62.3B Actual > Forecast = Good
for currency; USDINR
26.08.16 7:30PM Fed Chair Yellen Speaks
26.08.16 7:30PM Revised UoM Consumer
Sentimen
90.4 90.6 Actual > Forecast = Good
for currency; USDINR
26.08.16 All Day Jackson Hole Symposium
26th
Aug’2016
5. Currency Highlights
26th
Aug’2016
SEBI Certified – Research Analyst Equities I Commodities I Currencies I Mutual Funds
Amit Pathania
Digitally signed by Amit Pathania
DN: cn=Amit Pathania, o=Choice Equity Broking Pvt. ltd,
ou=Research Department, email=amit.pathania@choiceindia.com,
c=IN
Date: 2016.08.26 08:57:22 +05'30'