
Recommended
More Related Content
What's hot
What's hot (20)
Viewers also liked
Viewers also liked (13)
Similar to Currency Movements and Technical Analysis
Similar to Currency Movements and Technical Analysis (18)
Recently uploaded
Recently uploaded (20)
Currency Movements and Technical Analysis
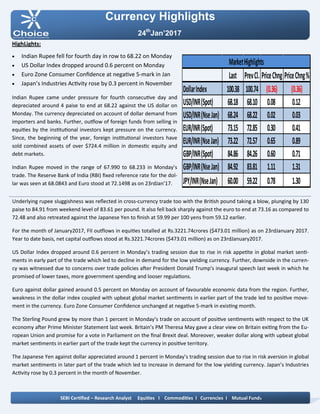
- 1. Currency Highlights 24th Jan’2017 HighLights: Indian Rupee fell for fourth day in row to 68.22 on Monday US Dollar Index dropped around 0.6 percent on Monday Euro Zone Consumer Confidence at negative 5-mark in Jan Japan’s Industries Activity rose by 0.3 percent in November Indian Rupee came under pressure for fourth consecutive day and depreciated around 4 paise to end at 68.22 against the US dollar on Monday. The currency depreciated on account of dollar demand from importers and banks. Further, outflow of foreign funds from selling in equities by the institutional investors kept pressure on the currency. Since, the beginning of the year, foreign institutional investors have sold combined assets of over $724.4 million in domestic equity and debt markets. Indian Rupee moved in the range of 67.990 to 68.233 in Monday’s trade. The Reserve Bank of India (RBI) fixed reference rate for the dol- lar was seen at 68.0843 and Euro stood at 72.1498 as on 23rdJan’17. Underlying rupee sluggishness was reflected in cross-currency trade too with the British pound taking a blow, plunging by 130 paise to 84.91 from weekend level of 83.61 per pound. It also fell back sharply against the euro to end at 73.16 as compared to 72.48 and also retreated against the Japanese Yen to finish at 59.99 per 100 yens from 59.12 earlier. For the month of January2017, FII outflows in equities totalled at Rs.3221.74crores ($473.01 million) as on 23rdJanuary 2017. Year to date basis, net capital outflows stood at Rs.3221.74crores ($473.01 million) as on 23rdJanuary2017. US Dollar Index dropped around 0.6 percent in Monday’s trading session due to rise in risk appetite in global market senti- ments in early part of the trade which led to decline in demand for the low yielding currency. Further, downside in the curren- cy was witnessed due to concerns over trade policies after President Donald Trump's inaugural speech last week in which he promised of lower taxes, more government spending and looser regulations. Euro against dollar gained around 0.5 percent on Monday on account of favourable economic data from the region. Further, weakness in the dollar index coupled with upbeat global market sentiments in earlier part of the trade led to positive move- ment in the currency. Euro Zone Consumer Confidence unchanged at negative 5-mark in existing month. The Sterling Pound grew by more than 1 percent in Monday’s trade on account of positive sentiments with respect to the UK economy after Prime Minister Statement last week. Britain’s PM Theresa May gave a clear view on Britain exiting from the Eu- ropean Union and promise for a vote in Parliament on the final Brexit deal. Moreover, weaker dollar along with upbeat global market sentiments in earlier part of the trade kept the currency in positive territory. The Japanese Yen against dollar appreciated around 1 percent in Monday’s trading session due to rise in risk aversion in global market sentiments in later part of the trade which led to increase in demand for the low yielding currency. Japan’s Industries Activity rose by 0.3 percent in the month of November. SEBI Certified – Research Analyst Equities I Commodities I Currencies I Mutual Funds Last PrevCl. PriceChng PriceChng% DollarIndex 100.38 100.74 (0.36) (0.36) USD/INR(Spot) 68.18 68.10 0.08 0.12 USD/INR(NseJan) 68.24 68.22 0.02 0.03 EUR/INR(Spot) 73.15 72.85 0.30 0.41 EUR/INR(NseJan) 73.22 72.57 0.65 0.89 GBP/INR(Spot) 84.86 84.26 0.60 0.71 GBP/INR(NseJan) 84.92 83.81 1.11 1.31 JPY/INR(NseJan) 60.00 59.22 0.78 1.30 MarketHighlights
- 2. Technical View: On hourly chart, the pair has given breakdown of its horizontal trend line at 60.20 levels. The price has given breakdown of its rising trend line at 60 levels on hourly chart. Moreover, prices have been trading below its 21 HSMA which gives the sign of bearishness in the prices. On daily chart momentum indicator RSI is trading below 40 levels which indicates down side momentum can be seen in the prices. In addition, momentum indicator MACD has shown neg- ative crossover which suggest lack of strength in the prices on hourly chart. So for trading perspective, one could JPYINR sell in the range of 60.15 with SL of 60.45 for target of 59.40 levels. Pivot levels for the Day Technical View: The pair has been moving in its rising channel pattern and prices have been hovering around of its lower band of channel pattern at 68.05 levels on hourly chart. The price has given breakout of its falling trend line at 68.10 levels on hourly chart. Moreover, prices have been trading above its 21 HSMA which gives the sign of bullishness in the prices. A momentum indicator RSI has shown bullish range shift at 50 levels, which suggest further positive momentum can be seen in the prices. In addition, momentum indicator MACD has shown positive crossover and moving above its signal line on hourly chart. So for trading perspective, one could buy USDINR in range 68.10 with SL of 67.90 for target of 68.50. Currency Highlights 24th Jan’2017 USDINR JPYINR SEBI Certified – Research Analyst Equities I Commodities I Currencies I Mutual Funds S3 S2 S1 Pivot R1 R2 R3 USDINR 67.70 67.93 68.09 68.16 68.32 68.39 68.62 JPYINR 58.96 59.45 59.72 59.94 60.21 60.43 60.92
- 3. Pivot levels for the Day Currency Highlights 24th Jan’2017 GBPINR EURINR Technical View: The price has taken support of its rising channel pattern at 72.70 levels on hourly chart. The EURINR pair has faced strong resistance of its horizontal trend line at 72.90 levels on hourly chart. The pair has been trading below its 21 HSMA on hourly chart, which suggest further weakness can be seen in the prices. On daily chart momentum oscillator RSI has been mov- ing below 50 levels on hourly chart, which suggest bearishness in the prices. A momentum indicator MACD has shown negative crossover on hourly chart, which support our bearish view to the prices. For now we can expect prices should move lower to- wards 72.60 levels in the coming trading session. Technical View: The prices has been facing resistance of its horizontal trend line at 84.20 levels on hourly chart. The price have shown breakdown of its rising trend line at 83.90 levels on hourly chart. Moreover, prices have been trading below 21 HSMA, which suggest short term trend looks weak. Moreover, momentum indicator MACD has given nega- tive cross over on hourly chart, which gives the sign of bearishness in the prices. The momentum indictor RSI has been trading below 60 levels on hourly chart, which suggest the possibilities of further downside momentum in the prices. For now we expect prices should move lower towards 84.20 levels coming trading sessions. SEBI Certified – Research Analyst Equities I Commodities I Currencies I Mutual Funds S3 S2 S1 Pivot R1 R2 R3 GBPINR 83.80 84.32 84.63 84.84 85.15 85.36 85.88 EURINR 72.85 73.02 73.11 73.19 73.28 73.36 73.53
- 4. Currency Highlights SEBI Certified – Research Analyst Equities I Commodities I Currencies I Mutual Funds 24th Jan’2017 Economic Indicators Date Time Data Prior Expected Impact 24.01.17 05:00 AM ECB President Draghi Speaks More hawkish than expected = Good for currency; 24.01.17 06:00 PM Flash Manufacturing PMI 52.4 52.3 Actual > Forecast = Good for currency; JPYINR 24.01.17 08:15 PM Flash Manufacturing PMI 54.3 54.6 Actual > Forecast = Good for currency; USDINR 24.01.17 08:30 PM Existing Home Sales 5.61M 5.54M Actual > Forecast = Good for currency; USDINR
- 5. Currency Highlights 24th Jan’2017 SEBI Certified – Research Analyst Equities I Commodities I Currencies I Mutual Funds Anish Vyas Digitally signed by Anish Vyas DN: cn=Anish Vyas, o=Choice Merchandise Broking Pvt. Ltd, ou=Sr. Research Associate, email=anish.vyas@choiceindia.com, c=IN Date: 2017.01.24 09:30:52 +05'30'