1. Currency Highlights
19th
Oct’2016
HighLights:
Indian Rupee rose by 15 paise to end at 66.73 in Tuesday’s trade
US Consumer Price Index (CPI) gained by 0.3 percent in September
China’s GDP unchanged at 6.7 percent for quarter ending in
Sep’16
UK’s Consumer Price Index (CPI) grew by 1 percent in September
China’s Gross Domestic Product (GDP) unchanged at 6.7 percent in
September quarter. Industrial Production fell to 6.1 percent in Sep-
tember from a rise of 6.3 percent in August. Fixed Asset Investment
grew by 8.2 percent in last month with respect to 8.1 percent in Au-
gust. Retail Sales jumped by 10.7 percent in September when com-
pared to 10.6 percent in August.
Indian Rupee recovered from its low and appreciated around 15 paise
to end at 66.73 against the US dollar on Tuesday. The currency appre-
ciated on account of selling of dollars from banks and exporters. Fur-
ther, upbeat domestic market sentiments led to positive movement in
the currency.
The Reserve Bank of India (RBI) fixed reference rate for the dollar was seen at 66.7268 and Euro stood at 73.5463 as on 18th
Oct’16. In cross-currency trades, the rupee retreated against the pound sterling to finish at 81.90 from 81.29. However, it re-
couped against the euro and finished at 73.40 as compared to 73.53 and also rebounded against the Japanese yen to settle at
64.19 from 64.23 per 100 yens earlier.
US Dollar Index gained marginally in Tuesday’s trading session due to favourable economic data from the country. However,
sharp rise in the currency was capped due to rise in risk appetite in global markets which led to decline in demand for the low
yielding currency.
US Consumer Price Index (CPI) gained by 0.3 percent in September as against a rise of 0.2 percent in August. Core CPI dropped
to 0.1 percent in September with respect to increase of 0.3 percent a month ago.
Euro against dollar fell around 0.17 percent on Tuesday on account of strength in the dollar index. However, sharp downside in
the currency was cushioned as a result of upbeat global market sentiments.
The Sterling Pound gained around 0.93 percent in Tuesday’s trade as a result of favourable economic data from the country.
Further, upbeat global market sentiments led to upside in the currency. However, sharp rise in the currency was prevented
due to strength in the dollar index.
UK’s Consumer Price Index (CPI) grew by 1 percent in September as against a gain of 0.6 percent in August. Retail Price Index
(RPI) jumped by 2 percent in last month from 1.8 percent in August. Core CPI increased by 1.5 percent in September with re-
spect to 1.3 percent a month ago.
The Japanese Yen against dollar appreciated marginally in Tuesday’s trading session due to rise in risk aversion in global mar-
ket sentiments in early part of the trade which led to increase in demand for the low yielding currency.
SEBI Certified – Research Analyst Equities I Commodities I Currencies I Mutual Funds
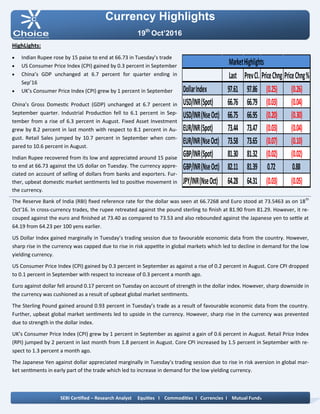
Last PrevCl. PriceChng PriceChng%
DollarIndex 97.61 97.86 (0.25) (0.26)
USD/INR(Spot) 66.76 66.79 (0.03) (0.04)
USD/INR(NseOct) 66.75 66.95 (0.20) (0.30)
EUR/INR(Spot) 73.44 73.47 (0.03) (0.04)
EUR/INR(NseOct) 73.58 73.65 (0.07) (0.10)
GBP/INR(Spot) 81.30 81.32 (0.02) (0.02)
GBP/INR(NseOct) 82.11 81.39 0.72 0.88
JPY/INR(NseOct) 64.28 64.31 (0.03) (0.05)
MarketHighlights
2. Technical View:
On daily chart JPYINR prices have been trading in sym-
metrical triangle pattern and shown breakdown of its
symmetrical triangle pattern. However, price has formed
bearish candle stick on daily chart.
Moreover, price has shown breakdown of its rising trend
line at 65 levels. On the other hand price has shown
breakdown of its rising trend line at 65.60 levels on daily
chart.
Furthermore, prices have been trading below its 21 DE-
MA, which suggest short term trend is negative.
On daily chart momentum indicator RSI is trading below
at 45 levels which suggest further weakness in the pric-
es.
So for trading perspective, one could use sell in the
range of 64.40 with SL of 64.80 for Target of 63.80 levels.
Pivot levels for the Day
Technical View:
On daily USDINR prices have been trading in falling
channel formation from past few weeks and prices have
been facing resistance at upper band of channel pattern
at 67.05 levels. The pair has formed bearish candle stick
with appealing volumes.
On the other hand, prices have been facing resistance of
horizontal trend line at 66.95 levels on daily chart.
Moreover, prices have been trading below 21 DEMA
which gives the sign of bearishness in the prices.
A momentum indictor RSI has traded below 60 levels,
which suggest further weakness in the prices.
In addition, momentum indicator MACD has shown neg-
ative crossover on daily chart.
So for trading perspective, one could sell in range 66.85
with SL of 67.15 for target of 66.10.
Currency Highlights
19th
Oct’2016
USDINR JPYINR
SEBI Certified – Research Analyst Equities I Commodities I Currencies I Mutual Funds
S3 S2 S1 Pivot R1 R2 R3
USDINR 66.51 66.67 66.76 66.83 66.92 66.99 67.15
JPYINR 63.74 64.01 64.15 64.28 64.42 64.55 64.82
3. Pivot levels for the Day
Currency Highlights
19th
Oct’2016
GBPINR EURINR
Technical View:
The EURINR pair has shown breakdown of its descend-
ing triangle pattern at 74 levels on daily chart. On the
other hand price has shown breakdown of its symmet-
rical triangle pattern at 74.80 levels on daily chart.
Moreover, prices have been trading below its 21 DE-
MA, which suggest short term trend is down. The pair
has shown breakdown of its horizontal trend line at
74.70 levels on daily chart.
On daily chart momentum oscillator RSI have been trad-
ing below 60 which suggest bearishness in the prices.
A momentum indicator MACD has shown negative
crossover on daily chart, which add more bearishness in
the prices.
For now we can expect prices should move lower to-
wards 73 levels in the coming trading session.
Technical View:
On daily GBPINR prices have been taking support of its
falling trend line at 81.20 levels. Moreover, prices have
been trading below 21 HEMA, which suggest short term
trend looks positive.
The price has formed bullish hammer candle stick
pattern on daily chart, which is bullish pattern.
A momentum indicator MADC has given positive Cross
over on hourly chart, which gives the sign of bullishness
in the prices.
The momentum indictor RSI has been trading in over-
sold zone levels on daily chart, which suggest the possi-
bilities of bounce back in the in the prices.
For now we expect prices should move higher towards
82.80 levels coming trading sessions.
SEBI Certified – Research Analyst Equities I Commodities I Currencies I Mutual Funds
S3 S2 S1 Pivot R1 R2 R3
GBPINR 81.03 81.51 81.80 81.99 82.28 82.47 82.95
EURINR 73.20 73.41 73.49 73.62 73.70 73.83 74.04
4. Currency Highlights
SEBI Certified – Research Analyst Equities I Commodities I Currencies I Mutual Funds
19th
Oct’2016
Economic Indicators
Date Time Data Prior Expected Impact
19.10.16 7:30 AM GDP q/y 6.7% 6.7% Actual< Forecast = Good for
currency; CNY
19.10.16 18th-19th Industrial Production y/y 6.3% 6.4% More hawkish than expected
= Good for currency; CNY
19.10.16 2:00 PM Average Earnings Index 3m/
y
2.3% 2.3% Actual > Forecast = Good
for currency; GBPINR
19.10.16 2:00 PM Claimant Count Change 2.4K 3.4K Actual > Forecast = Good
for currency; GBPINR
19.10.16 2:00 PM Unemployment Rate 4.9% 4.9% Actual < Forecast = Good
for currency; USDINR
19.10.16 6:00 PM Building Permits 1.14M 1.17M More hawkish than expected
= Good for currency;
19.10.16 8:00 PM Crude Oil Inventories 4.9M
5. Currency Highlights
19th
Oct’2016
SEBI Certified – Research Analyst Equities I Commodities I Currencies I Mutual Funds
Amit Pathania
Digitally signed by Amit Pathania
DN: cn=Amit Pathania, o=Choice Equity Broking Pvt. ltd, ou=Research
Department, email=amit.pathania@choiceindia.com, c=IN
Date: 2016.10.19 09:15:03 +05'30'