
Recommended
More Related Content
What's hot
What's hot (20)
Similar to Currency high lights 17.11.16
Similar to Currency high lights 17.11.16 (19)
Recently uploaded
Recently uploaded (20)
Currency high lights 17.11.16
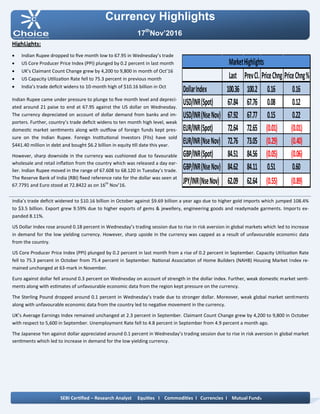
- 1. Currency Highlights 17th Nov’2016 HighLights: Indian Rupee dropped to five month low to 67.95 in Wednesday’s trade US Core Producer Price Index (PPI) plunged by 0.2 percent in last month UK’s Claimant Count Change grew by 4,200 to 9,800 in month of Oct’16 US Capacity Utilization Rate fell to 75.3 percent in previous month India’s trade deficit widens to 10-month high of $10.16 billion in Oct Indian Rupee came under pressure to plunge to five month level and depreci- ated around 21 paise to end at 67.95 against the US dollar on Wednesday. The currency depreciated on account of dollar demand from banks and im- porters. Further, country’s trade deficit widens to ten month high level, weak domestic market sentiments along with outflow of foreign funds kept pres- sure on the Indian Rupee. Foreign Institutional Investors (FIIs) have sold $441.40 million in debt and bought $6.2 billion in equity till date this year. However, sharp downside in the currency was cushioned due to favourable wholesale and retail inflation from the country which was released a day ear- lier. Indian Rupee moved in the range of 67.608 to 68.120 in Tuesday’s trade. The Reserve Bank of India (RBI) fixed reference rate for the dollar was seen at 67.7791 and Euro stood at 72.8422 as on 16th Nov’16. India’s trade deficit widened to $10.16 billion in October against $9.69 billion a year ago due to higher gold imports which jumped 108.4% to $3.5 billion. Export grew 9.59% due to higher exports of gems & jewellery, engineering goods and readymade garments. Imports ex- panded 8.11%. US Dollar Index rose around 0.18 percent in Wednesday’s trading session due to rise in risk aversion in global markets which led to increase in demand for the low yielding currency. However, sharp upside in the currency was capped as a result of unfavourable economic data from the country. US Core Producer Price Index (PPI) plunged by 0.2 percent in last month from a rise of 0.2 percent in September. Capacity Utilization Rate fell to 75.3 percent in October from 75.4 percent in September. National Association of Home Builders (NAHB) Housing Market Index re- mained unchanged at 63-mark in November. Euro against dollar fell around 0.3 percent on Wednesday on account of strength in the dollar index. Further, weak domestic market senti- ments along with estimates of unfavourable economic data from the region kept pressure on the currency. The Sterling Pound dropped around 0.1 percent in Wednesday’s trade due to stronger dollar. Moreover, weak global market sentiments along with unfavourable economic data from the country led to negative movement in the currency. UK’s Average Earnings Index remained unchanged at 2.3 percent in September. Claimant Count Change grew by 4,200 to 9,800 in October with respect to 5,600 in September. Unemployment Rate fell to 4.8 percent in September from 4.9 percent a month ago. The Japanese Yen against dollar appreciated around 0.1 percent in Wednesday’s trading session due to rise in risk aversion in global market sentiments which led to increase in demand for the low yielding currency. SEBI Certified – Research Analyst Equities I Commodities I Currencies I Mutual Funds Last PrevCl. PriceChng PriceChng% DollarIndex 100.36 100.2 0.16 0.16 USD/INR(Spot) 67.84 67.76 0.08 0.12 USD/INR(NseNov) 67.92 67.77 0.15 0.22 EUR/INR(Spot) 72.64 72.65 (0.01) (0.01) EUR/INR(NseNov) 72.76 73.05 (0.29) (0.40) GBP/INR(Spot) 84.51 84.56 (0.05) (0.06) GBP/INR(NseNov) 84.62 84.11 0.51 0.60 JPY/INR(NseNov) 62.09 62.64 (0.55) (0.89) MarketHighlights
- 2. Technical View: On daily chart JPYINR prices have been trading in hori- zontal channel pattern and price has taken support of its lower band at 63.10 levels. Moreover, price has taken support of its horizontal trend line at 63 levels on daily chart. Furthermore, prices have been trading above its 20 HE- MA, which suggest short term trend is positive. On daily chart momentum indicator RSI is trading above 40 levels which suggest further bullishness can be seen in the prices. In addition, momentum indicator MACD has shown posi- tive crossover on hourly chart. So for trading perspective, one could use buy in the range of 61.90 with SL of 61.50 for target of 62.50 levels. Pivot levels for the Day Technical View: The pair has given breakout of its falling channel pattern at 67.10 levels on daily chart. On daily USDINR prices have shown breakout of its falling trend line at 67.20 levels. Moreover, prices have been trading above its 50 DEMA which gives the sign of bullishness in the prices. A momentum indictor RSI has traded above 60 levels, which suggest further positive momentum can be seen in the prices. In addition, momentum indicator MACD has shown pos- itive crossover on daily chart. So for trading perspective, one could buy in range 67.80 with SL of 66.50 for target of 68.30. Currency Highlights 17th Nov’2016 USDINR JPYINR SEBI Certified – Research Analyst Equities I Commodities I Currencies I Mutual Funds S3 S2 S1 Pivot R1 R2 R3 USDINR 67.27 67.56 67.74 67.85 68.03 68.14 68.43 JPYINR 61.57 61.85 61.95 62.13 62.23 62.41 62.69
- 3. Pivot levels for the Day Currency Highlights 17th Nov’2016 GBPINR EURINR Technical View: The price have been trading in descending triangle pattern form past few weeks. The EURINR pair has been trading in falling channel pattern and prices have been taking support of its lower band of channel pattern at 73.20 levels on daily chart. On the other hand price has taken support of its hori- zontal trend line at 73.80 levels on daily chart. On daily chart momentum oscillator RSI have been trad- ing above 45 which suggest bullishness in the prices. A momentum indicator MACD has shown positive cross- over on hourly chart, which add more bullishness in the prices. For now we can expect prices should move higher to- wards 73.50 levels in the coming trading session. Technical View: The pair has shown breakout of its horizontal channel pattern at 84.80 levels on daily chart. Moreover, prices have been trading above 50 DEMA, which suggest short term trend looks positive. The price has formed bullish hammer candle stick pattern on daily chart, which is bullish pattern. A momentum indicator MADC has given positive Cross over on hourly chart, which gives the sign of bullishness in the prices. The momentum indictor RSI has been trading above 60 levels on daily chart, which suggest the possibilities of bounce back in the in the prices. For now we expect prices should move higher towards 85.30 levels coming trading sessions. SEBI Certified – Research Analyst Equities I Commodities I Currencies I Mutual Funds S3 S2 S1 Pivot R1 R2 R3 GBPINR 83.85 84.25 84.44 84.65 84.84 85.05 85.45 EURINR 72.16 72.49 72.61 72.82 72.94 73.15 73.48
- 4. Currency Highlights SEBI Certified – Research Analyst Equities I Commodities I Currencies I Mutual Funds 17th Nov’2016 Economic Indicators Date Time Data Prior Expected Impact 17.11.16 17th-18th Foreign Direct Investment ytd/y 4.2% Actual > Forecast = Good for currency; CNY 17.11.16 03:00 PM Retail Sales m/m 0.0% 0.5% Actual > Forecast = Good for currency; GBPINR 17.11.16 07:00 PM Building Permits 1.23M 1.19M Actual > Forecast = Good for currency; USDINR 17.11.16 07:00 PM CPI m/m 0.3% 0.4% Actual > Forecast = Good for currency; USDINR 17.11.16 07:00 PM Core CPI m/m 0.1% 0.2% Actual > Forecast = Good for currency; USDINR 17.11.16 07:00 PM Philly Fed Manufacturing In- dex 9.7 8.1 Actual > Forecast = Good for currency; USDINR 17.11.16 07:00 PM Unemployment Claims 254K 257K Actual < Forecast = Good for currency; USDINR 17.11.16 08:30 PM Fed Chair Yellen Testifies More hawkish than expected = Good for currency;
- 5. Currency Highlights 17th Nov’2016 SEBI Certified – Research Analyst Equities I Commodities I Currencies I Mutual Funds Amit Pathania Digitally signed by Amit Pathania DN: cn=Amit Pathania, o=Choice Equity Broking Pvt. ltd, ou=Research Department, email=amit.pathania@choiceindia.com, c=IN Date: 2016.11.17 09:15:08 +05'30'