
Recommended
More Related Content
What's hot
What's hot (20)
Viewers also liked
Viewers also liked (13)
Similar to Currency high lights 03.01.17
Similar to Currency high lights 03.01.17 (19)
Recently uploaded
Recently uploaded (20)
Currency high lights 03.01.17
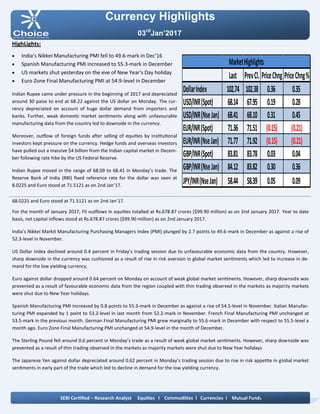
- 1. Currency Highlights 03rd Jan’2017 HighLights: India’s Nikkei Manufacturing PMI fell to 49.6-mark in Dec’16 Spanish Manufacturing PMI increased to 55.3-mark in December US markets shut yesterday on the eve of New Year's Day holiday Euro Zone Final Manufacturing PMI at 54.9-level in December Indian Rupee came under pressure in the beginning of 2017 and depreciated around 30 paise to end at 68.22 against the US dollar on Monday. The cur- rency depreciated on account of huge dollar demand from importers and banks. Further, weak domestic market sentiments along with unfavourable manufacturing data from the country led to downside in the currency. Moreover, outflow of foreign funds after selling of equities by institutional investors kept pressure on the currency. Hedge funds and overseas investors have pulled out a massive $4 billion from the Indian capital market in Decem- ber following rate hike by the US Federal Reserve. Indian Rupee moved in the range of 68.09 to 68.41 in Monday’s trade. The Reserve Bank of India (RBI) fixed reference rate for the dollar was seen at 8.0225 and Euro stood at 71.5121 as on 2nd Jan’17. 68.0225 and Euro stood at 71.5121 as on 2nd Jan’17. For the month of January 2017, FII outflows in equities totalled at Rs.678.87 crores ($99.90 million) as on 2nd January 2017. Year to date basis, net capital inflows stood at Rs.678.87 crores ($99.90 million) as on 2nd January 2017. India’s Nikkei Markit Manufacturing Purchasing Managers Index (PMI) plunged by 2.7 points to 49.6-mark in December as against a rise of 52.3-level in November. US Dollar Index declined around 0.4 percent in Friday’s trading session due to unfavourable economic data from the country. However, sharp downside in the currency was cushioned as a result of rise in risk aversion in global market sentiments which led to increase in de- mand for the low yielding currency. Euro against dollar dropped around 0.64 percent on Monday on account of weak global market sentiments. However, sharp downside was prevented as a result of favourable economic data from the region coupled with thin trading observed in the markets as majority markets were shut due to New Year holidays. Spanish Manufacturing PMI increased by 0.8 points to 55.3-mark in December as against a rise of 54.5-level in November. Italian Manufac- turing PMI expanded by 1 point to 53.2-level in last month from 52.2-mark in November. French Final Manufacturing PMI unchanged at 53.5-mark in the previous month. German Final Manufacturing PMI grew marginally to 55.6-mark in December with respect to 55.5-level a month ago. Euro Zone Final Manufacturing PMI unchanged at 54.9-level in the month of December. The Sterling Pound fell around 0.6 percent in Monday’s trade as a result of weak global market sentiments. However, sharp downside was prevented as a result of thin trading observed in the markets as majority markets were shut due to New Year holidays The Japanese Yen against dollar depreciated around 0.62 percent in Monday’s trading session due to rise in risk appetite in global market sentiments in early part of the trade which led to decline in demand for the low yielding currency. SEBI Certified – Research Analyst Equities I Commodities I Currencies I Mutual Funds Last PrevCl. PriceChng PriceChng% DollarIndex 102.74 102.38 0.36 0.35 USD/INR(Spot) 68.14 67.95 0.19 0.28 USD/INR(NseJan) 68.41 68.10 0.31 0.45 EUR/INR(Spot) 71.36 71.51 (0.15) (0.21) EUR/INR(NseJan) 71.77 71.92 (0.15) (0.21) GBP/INR(Spot) 83.81 83.78 0.03 0.04 GBP/INR(NseJan) 84.12 83.82 0.30 0.36 JPY/INR(NseJan) 58.44 58.39 0.05 0.09 MarketHighlights
- 2. Technical View: On daily chart, it has been observed that the JPYINR has completed a Bullish Bat harmonic pattern at 57.55 levels the coordinates of which are as follows: Technical Parameter: XA of the leg from 56 to 67.90,AB of the leg completed at 63.30 (i.e.38.20% of XA leg.), BC of the leg completed at 67.50 (i.e. near 88.60% of AB leg) and CD of the leg completed at 57.55 level. (i.e. 88% of XA and 224% of BC leg). On daily chart momentum indicator RSI is trading in oversold zone which indicates up side momentum can be seen in the prices. In addition, momentum indicator MACD has shown posi- tive crossover which suggest possibilities of rebound in the prices on daily chart. So for trading perspective, one could JPYINR buy in the range of 58.25 with SL of 57.90 for target of 58.80 levels. Pivot levels for the Day Technical View: The pair has shown breakout of its horizontal channel at 67.50 levels on daily chart and price has retested its breakout trend line at 67.40 levels. On daily chart price has taken support of its 61.80% Fib- onacci retracement levels. Moreover, prices have been trading above its 50 DEMA which gives the sign of bullishness in the prices. A momentum indicator RSI has been trading above 40 levels, which suggest further positive momentum can be seen in the prices. In addition, momentum indicator MACD has shown positive crossover on hourly chart. So for trading perspective, one could buy USDINR in range 68.30 with SL of 68 for target of 68.85. Currency Highlights 03rd Jan’2017 USDINR JPYINR SEBI Certified – Research Analyst Equities I Commodities I Currencies I Mutual Funds S3 S2 S1 Pivot R1 R2 R3 USDINR 67.50 67.89 68.15 68.28 68.54 68.67 69.06 JPYINR 57.81 58.09 58.27 58.37 58.55 58.65 58.93
- 3. Pivot levels for the Day Currency Highlights 03rd Jan’2017 GBPINR EURINR Technical View: The price has taken support of its horizontal trend line at 70.60 levels on daily chart. The EURINR pair has also taken support of its falling trend line at 70.70 levels on daily chart. The pair has been trading above its 15 HEMA on hourly chart, which suggest further bullishness can be seen in the prices. On daily chart momentum oscillator RSI has moved up form its oversold zone, which suggest bullishness in the prices. A momentum indicator MACD has shown positive cross- over on 4 hourly chart, which support our bullish view to the prices. For now we can expect prices should move higher to- wards 72.40 levels in the coming trading session. Technical View: The price has shown breakdown of its rising channel pattern at 85 levels on daily chart. The pair has been facing resistance of its falling trend line at 86.10 levels on daily chart. The prices have been facing resistance of its horizontal line at 86 levels. Moreover, prices have been trading below 50 DEMA, which suggest short term trend looks negative. Moreover, momentum indicator MACD has given nega- tive cross over on daily chart, which gives the sign of bearishness in the prices. The momentum indictor RSI has been trading below 60 levels on daily chart, which suggest the possibilities of further weakness in the prices. For now we expect prices should move lower towards 83.40 levels coming trading sessions. SEBI Certified – Research Analyst Equities I Commodities I Currencies I Mutual Funds S3 S2 S1 Pivot R1 R2 R3 GBPINR 83.63 83.87 84.00 84.11 84.24 84.35 84.59 EURINR 71.19 71.46 71.62 71.73 71.89 72.00 72.27
- 4. Currency Highlights SEBI Certified – Research Analyst Equities I Commodities I Currencies I Mutual Funds 03rd Jan’2017 Economic Indicators Date Time Data Prior Expected Impact 03.01.17 07:15 AM Caixin Manufacturing PMI 50.9 50.9 Actual > Forecast = Good for currency; CNY 03.01.17 03:00 PM Manufacturing PMI 53.4 53.3 Actual > Forecast = Good for currency; GBPINR 03.01.17 08:15 PM Final Manufacturing PMI 54.2 54.2 Actual > Forecast = Good for currency; USDINR 03.01.17 08:30 PM ISM Manufacturing PMI 53.2 53.7 Actual > Forecast = Good for currency; USDINR
- 5. Currency Highlights 03rd Jan’2017 SEBI Certified – Research Analyst Equities I Commodities I Currencies I Mutual Funds Anish Vyas Digitally signed by Anish Vyas DN: cn=Anish Vyas, o=Choice Merchandise Broking Pvt. Ltd, ou=Sr. Research Associate, email=anish.vyas@choiceindia.com, c=IN Date: 2017.01.03 08:53:58 +05'30'