Maximize Your Business Potential with Falcon Invoice Discounting
Currency high lights 14.06.16
1. Currency Highlights
14th
June’2016
HighLights:
India’s Consumer Price Index (CPI) rose to 5.76 percent in May
US Federal Reserve meeting to start from today’s trading session
Indian Rupee ended at one week low of 67.14 in Monday’s trade
Indian Rupee depreciated for third consecutive day and plunged by 38 pai-
se to end at 67.14 against the US dollar on Monday. The currency was un-
der pressure on account of persistent dollar demand from importers and
banks. Further, weak domestic market sentiments led to negative move-
ment in the currency.
Additionally, fear of outflow of foreign funds from equities and debts led
to downside movement in the currency. Moreover, unfavourable retail
inflation data in yesterday’s trade and forecast for rise in wholesale infla-
tion data will constantly lead to pressure on the Indian Rupee. Indian Ru-
pee moved in the range of 66.94 to 67.19 in Monday’s trading session. The
Reserve Bank of India (RBI) reference rate for dollar was seen at 67.0737
and Euro stood at 75.5116 on Monday.
In cross-currency trades, the rupee firmed up further against the pound sterling to close at 95.24 from the last weekend’s level
of 96.24 while moved down against the euro to 75.67 from 75.46 per euro previously. The domestic currency also fell against
the yen to 63.33 from 62.47.
India’s Consumer Price Index (CPI) rose to 5.76 percent in May as against a rise of 5.39 percent in April.
US Dollar Index declined around 0.15 percent in Monday’s trading session due to uncertainty over the hike in interest rates by
the Federal Reserve in its meeting starting from today.
However, sharp downside in the currency was cushioned due to rise in risk aversion in global market sentiments which led to
increase in demand for the low yielding currency.
Euro against dollar gained around 0.44 percent on Monday on account of weakness in the dollar index coupled with estimates
of favourable economic data from the region in the coming days.
However, weak global market sentiments capped sharp positive movement in the currency.
The Sterling Pound rose around 0.1 percent in Monday’s trade on account of weaker dollar. But, weakness in the global mar-
ket sentiments restricted upside movement in the currency.
The Japanese Yen against dollar appreciated around 0.3 percent in Monday’s trade due to rise in risk aversion in global market
sentiments which led to increase in demand for the low yielding currency. However, investors were cautious ahead of the
Bank of Japan meeting on Thursday.
SEBI Certified – Research Analyst Equities I Commodities I Currencies I Mutual Funds
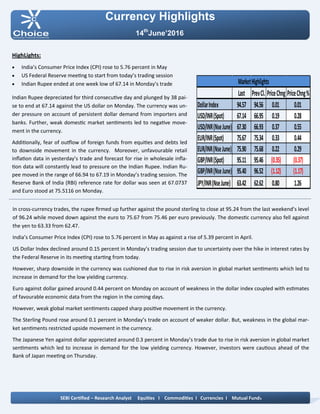
Last PrevCl. PriceChng PriceChng%
DollarIndex 94.57 94.56 0.01 0.01
USD/INR(Spot) 67.14 66.95 0.19 0.28
USD/INR(NseJune) 67.30 66.93 0.37 0.55
EUR/INR(Spot) 75.67 75.34 0.33 0.44
EUR/INR(NseJune) 75.90 75.68 0.22 0.29
GBP/INR(Spot) 95.11 95.46 (0.35) (0.37)
GBP/INR(NseJune) 95.40 96.52 (1.12) (1.17)
JPY/INR(NseJune) 63.42 62.62 0.80 1.26
MarketHighlights
2. Technical View:
The JPYINR price has been trading in rectangle pattern form
past few weeks and price has shown breakout of its resistance
which is upper band of channel pattern at 63 levels on daily
chart.
In addition, on daily chart prices have been trading above its
21 day exponential moving average which gives the positive
confirmation to the prices.
On daily chart, momentum oscillator RSI has moved above 60
levels, which gives positive confirmation to the prices.
A momentum indicator MACD has shown positive crossover
on daily chart, which indicates short term trend remains bull-
ish.
For now we expect prices to move higher towards 63.90 lev-
els in few trading sessions.
Pivot levels for the Day
Technical View:
The price has been trading in its rising channel formation
from past few weeks and price has taken support of its of its
lower band of channel pattern at 66.90 levels on daily chart.
Price has formed piercing candle stick pattern on daily chart,
which is bullish pattern.
Moreover, price have been trading above of its 21 daily expo-
nential moving average which suggest near term remains up.
So any dips in the prices towards 67.15 level, used as buying
opportunity.
A momentum indicator RSI has moved above 45 levels on
daily chart, which suggest bullishness in the prices.
A momentum indictor MACD has given positive crossover on
4 hourly chart, which gives positive confirmation to the pric-
es.
For now we expect prices to move higher towards 67.70 lev-
els in few trading sessions.
Currency Highlights
14th
June’2016
USDINR JPYINR
SEBI Certified – Research Analyst Equities I Commodities I Currencies I Mutual Funds
S3 S2 S1 Pivot R1 R2 R3
USDINR 62.49 62.91 63.16 63.33 63.58 63.75 64.17
JPYINR 66.72 66.98 67.13 67.24 67.39 67.50 67.76
3. Pivot levels for the Day
Currency Highlights
14th
June’2016
GBPINR EURINR
Technical View:
The pair has given breakdown of its symmetrical triangle
pattern at 76.10 levels on daily chart. Now, the price has re-
tested the breakdown trend line at 76.30 levels.
Moreover, pair has retested the its upward trend line break-
down levels of 76.50 levels on daily chart.
On the other hand, Pair has been trading below its 21 daily
exponential moving average which indicates that trend is
remains negative.
A momentum oscillator RSI have been trading below 60 lev-
els on daily chart which gives the signs of bearishness to the
prices.
Moreover, momentum indicator MACD has shown negative
crossover on daily chart which support our bearish view on
the pair.
For now we expect prices should move lower towards 75.20
levels in the coming trading sessions.
Technical View:
The prices have been moving in rectangle formation form
past few months and prices have been facing resistance of its
upper band of pattern at 98 levels.
On the other hand, Pair has been trading below its 21 daily
exponential moving average which indicates that short term
trend is remains bearish.
A momentum indicator RSI has moved below 45 levels on
daily chart, which suggest bearishness in the prices.
Moreover, momentum indicator MACD has shown negative
crossover on daily chart which support our bearish view on
the pair.
For now we expect prices should move lower towards 96.70
levels in the coming trading sessions.
SEBI Certified – Research Analyst Equities I Commodities I Currencies I Mutual Funds
S3 S2 S1 Pivot R1 R2 R3
GBPINR 94.34 94.86 95.11 95.38 95.63 95.90 96.42
EURINR 74.87 75.32 75.60 75.77 76.05 76.22 76.67
4. Currency Highlights
SEBI Certified – Research Analyst Equities I Commodities I Currencies I Mutual Funds
Economic Indicators
Date Time Data Prior Expected Impact
14.06.16 2:00pm CPI y/y 0.3% 0.4% Actual > Forecast = Good for
currency; GBPINR
14.06.16 2:00pm PPI Input m/m 0.9% 0.9% Actual > Forecast = Good for
currency; GBPINR
14.06.16 2:00pm RPI y/y 1.3% 1.5% Actual > Forecast = Good for
currency; GBPINR
14.06.16 6:00pm Core Retail Sales m/m 0.8% 0.4% Actual > Forecast = Good for
currency; USDINR
14.06.16 6:00pm Retail Sales m/m 1.3% 0.4% Actual > Forecast = Good for
currency; USDINR
14.06.16 6:00pm Import Prices m/m 0.3% 0.8% Actual > Forecast = Good for
currency; USDINR
14th
June’2016
5. Currency Highlights
14th
June’2016
SEBI Certified – Research Analyst Equities I Commodities I Currencies I Mutual Funds
Amit Pathania
Digitally signed by Amit Pathania
DN: cn=Amit Pathania, o=Choice Equity Broking Pvt. ltd, ou=Research
Department, email=amit.pathania@choiceindia.com, c=IN
Date: 2016.06.14 08:48:20 +05'30'