Retail sector trends for 2024 | European Business Review
Currency high lights 06.12.16
1. Currency Highlights
06th
Dec’2016
HighLights:
India’s Nikkei Services PMI plunged by 7.8 points to 46.7-mark in Novem-
ber
US ISM Non-Manufacturing PMI surged to 57.2-level in previous month
Euro Zone Sentix Investor Confidence fell to 10-mark in December
UK’s Services PMI surged by 0.7 points to 55.2-mark in November
Japan’s Consumer Confidence plunged to 40.9-mark in November
Indian Rupee appreciated marginally and closed on flat note at 68.21 against
the US dollar on Monday. The currency appreciated on account of upbeat
domestic market sentiments.
Further, investors were cautious ahead of the fifth bi-monthly Monetary Poli-
cy Statement for 2016-17 to be held on 6-7th
Dec’16. Indian Rupee moved in
the range of 68.12 to 68.27 in Monday’s trade. The Reserve Bank of India
(RBI) fixed reference rate for the dollar was seen at 68.1703 and Euro stood
at 72.0424 as on 5th
Dec’16.
India’s Nikkei Services Purchasing Managers' Index (PMI) plunged by 7.8
points to 46.7-mark in November as against a rise of 54.5-level in October.
For the month of December 2016, FII outflows in equities totalled at Rs.886.68 crores ($129.56 million) as on 5th
December 2016. Year to
date basis, net capital inflows stood at Rs.27855.79 crores ($4242.25 million) as on 5th
December 2016.
US Dollar Index fell around 0.74 percent in Monday’s trading session due to rise in risk appetite in global markets which led to decline in
demand for the low yielding currency. However, estimates of hike in interest rates by the Federal Reserve in its Dec’16 meeting along with
favourable economic data from the country cushioned sharp negative movement in the currency.
US Final Services Purchasing Managers' Index (PMI) dropped marginally to 54.6-mark in November as against a rise of 54.7-level in October.
The Institute for Supply Management (ISM) Non-Manufacturing Purchasing Managers' Index (PMI) surged by 2.4 points to 57.2-level in pre-
vious month from 54.8-mark in October.
Euro against dollar rose by more than 1.8 percent on Monday on account of weakness in the dollar index. Further, favourable economic
data from the region, upbeat domestic market sentiments along with denial in Italian referendum led to upside movement in the currency.
Spanish Services Purchasing Managers' Index (PMI) rose by 0.5 points to 55.1-mark in November as against a rise of 54.6-level in October.
Italian Services PMI gained by 2.3 points to 53.3-level in last month from 51-mark in October. French Final Services PMI plunged by 1 points
to 51.6-mark in November with respect to 52.6-level a month ago. German Final Services PMI grew marginally to 55.1-level in previous
month when compared to 55-mark in October. Final Services PMI dropped to 53.8-mark in November as compared to 54.1-level in earlier
month. Euro Zone Sentix Investor Confidence fell to 10-mark in December from 13.1-level in November. Euro Region Retail Sales grew by
1.1 percent in October with respect to decline of 0.4 percent in September.
The Sterling Pound gained around 0.5 percent in Monday’s trade as a result of weaker dollar. Further, upbeat global market sentiments
along with favourable economic data from the country led to gains in the currency. UK’s Services PMI surged by 0.7 points to 55.2-mark in
November from 54.5-level in October.
The Japanese Yen against dollar depreciated around 0.3 percent in Monday’s trading session due to rise in risk appetite in global market
sentiments which led to decline in demand for the low yielding currency.
Japan’s Consumer Confidence plunged by 1.4 points to 40.9-mark in November as against a rise of 42.3-level in October.
SEBI Certified – Research Analyst Equities I Commodities I Currencies I Mutual Funds
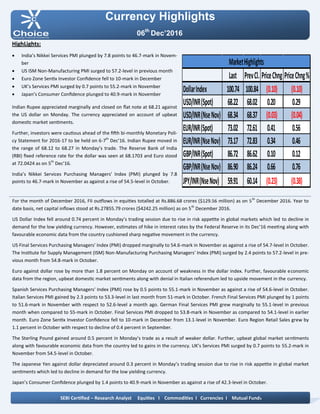
Last PrevCl. PriceChng PriceChng%
DollarIndex 100.74 100.84 (0.10) (0.10)
USD/INR(Spot) 68.22 68.02 0.20 0.29
USD/INR(NseNov) 68.34 68.37 (0.03) (0.04)
EUR/INR(Spot) 73.02 72.61 0.41 0.56
EUR/INR(NseNov) 73.17 72.83 0.34 0.46
GBP/INR(Spot) 86.72 86.62 0.10 0.12
GBP/INR(NseNov) 86.90 86.24 0.66 0.76
JPY/INR(NseNov) 59.91 60.14 (0.23) (0.38)
MarketHighlights
2. Technical View:
On daily chart JPYINR price has shown breakdown of its
falling channel pattern at 61.60 levels. The price has giv-
en breakdown of its descending triangle pattern at 61
levels on daily chart.
Moreover, prices have been trading below its 21 DEMA
which gives the sign of bearishness in the prices.
On daily chart momentum indicator RSI is trading below
50 levels which suggest further weakness can be seen in
the prices.
In addition, momentum indicator MACD has shown neg-
ative crossover and trading below signal line on daily
chart.
So for trading perspective, one could JPYINR sell in the
range of 60.10 with SL of 60.50 for target of 59.60 levels.
Pivot levels for the Day
Technical View:
The pair has been facing resistance of its rising trend
line at 68.85 levels on daily chart. On daily chart USDINR
price has faced resistance of its horizontal trend line at
68.90 levels.
Moreover, prices have been trading below its 21 HEMA
which gives the sign of bearishness in the prices.
A momentum indicator RSI has been trading below 65
levels, which suggest further positive momentum can be
seen in the prices.
In addition, momentum indicator MACD has shown
negative crossover on 4 hourly chart.
So for trading perspective, one could sell USDINR in
range 68.50 with SL of 68.90 for target of 67.80.
Currency Highlights
06th
Dec’2016
USDINR JPYINR
SEBI Certified – Research Analyst Equities I Commodities I Currencies I Mutual Funds
S3 S2 S1 Pivot R1 R2 R3
USDINR 68.00 68.16 68.25 68.32 68.41 68.48 68.64
JPYINR 59.05 59.54 59.73 60.03 60.22 60.52 61.01
3. Pivot levels for the Day
Currency Highlights
06th
Dec’2016
GBPINR EURINR
Technical View:
The price has shown breakdown of its descending trian-
gle a pattern at 72.70 levels on daily chart. The EURINR
pair has shown horizontal trend line at 72.80 levels on
daily chart.
The pair has been trading below its 50 DEMA on daily
chart, which suggest further weakness can be seen in
the prices.
On daily chart momentum oscillator RSI have been trad-
ing below 60 which suggest bearishness in the prices.
A momentum indicator MACD has shown negative
crossover on daily chart, which add more bearishness
in the prices.
For now we can expect prices should move lower to-
wards 72.20 levels in the coming trading session.
Technical View:
The pair has shown breakout of its rising channel
pattern at 85 levels on daily chart. The price has been
hovering around its falling trend line at 87.10 levels.
Moreover, prices have been trading above 21 DEMA,
which suggest short term trend looks positive.
Moreover, price has shown breakout of its horizontal
trend line at 84.60 levels on daily chart.
A momentum indicator MADC has given positive Cross
over on hourly chart, which gives the sign of bullishness
in the prices.
The momentum indictor RSI has been trading above 60
levels on daily chart, which suggest the possibilities of
bounce back in the in the prices.
For now we expect prices should move higher towards
87.60 levels coming trading sessions.
SEBI Certified – Research Analyst Equities I Commodities I Currencies I Mutual Funds
S3 S2 S1 Pivot R1 R2 R3
GBPINR 85.81 86.31 86.61 86.81 87.11 87.31 87.81
EURINR 70.21 71.51 72.34 72.81 73.64 74.11 75.41
4. Currency Highlights
SEBI Certified – Research Analyst Equities I Commodities I Currencies I Mutual Funds
06th
Dec’2016
Economic Indicators
Date Time Data Prior Expected Impact
06.12.16 07:00 PM Revised Nonfarm Productivi-
ty q/q
3.1% 3.2% Actual < Forecast = Good
for currency; USDINR
06.12.16 07:00 PM Trade Balance -36.4B -41.5B Actual > Forecast = Good
for currency; USDINR
06.12.16 07:00 PM Revised Unit Labor Costs q/
q
0.3% 0.4% Actual > Forecast = Good
for currency; USDINR
5. Currency Highlights
06th
Dec’2016
SEBI Certified – Research Analyst Equities I Commodities I Currencies I Mutual Funds
Amit Pathania
Digitally signed by Amit Pathania
DN: cn=Amit Pathania, o=Choice Equity Broking Pvt. ltd, ou=Research
Department, email=amit.pathania@choiceindia.com, c=IN
Date: 2016.12.06 09:07:38 +05'30'