
Recommended
More Related Content
What's hot
What's hot (20)
Similar to Currency high lights 13.06.16
Similar to Currency high lights 13.06.16 (20)
Recently uploaded
Recently uploaded (20)
Currency high lights 13.06.16
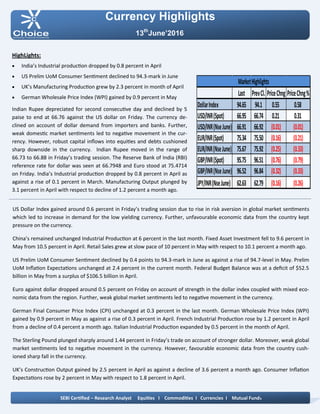
- 1. Currency Highlights 13th June’2016 HighLights: India’s Industrial production dropped by 0.8 percent in April US Prelim UoM Consumer Sentiment declined to 94.3-mark in June UK’s Manufacturing Production grew by 2.3 percent in month of April German Wholesale Price Index (WPI) gained by 0.9 percent in May Indian Rupee depreciated for second consecutive day and declined by 5 paise to end at 66.76 against the US dollar on Friday. The currency de- clined on account of dollar demand from importers and banks. Further, weak domestic market sentiments led to negative movement in the cur- rency. However, robust capital inflows into equities and debts cushioned sharp downside in the currency. Indian Rupee moved in the range of 66.73 to 66.88 in Friday’s trading session. The Reserve Bank of India (RBI) reference rate for dollar was seen at 66.7948 and Euro stood at 75.4714 on Friday. India’s Industrial production dropped by 0.8 percent in April as against a rise of 0.1 percent in March. Manufacturing Output plunged by 3.1 percent in April with respect to decline of 1.2 percent a month ago. US Dollar Index gained around 0.6 percent in Friday’s trading session due to rise in risk aversion in global market sentiments which led to increase in demand for the low yielding currency. Further, unfavourable economic data from the country kept pressure on the currency. China’s remained unchanged Industrial Production at 6 percent in the last month. Fixed Asset Investment fell to 9.6 percent in May from 10.5 percent in April. Retail Sales grew at slow pace of 10 percent in May with respect to 10.1 percent a month ago. US Prelim UoM Consumer Sentiment declined by 0.4 points to 94.3-mark in June as against a rise of 94.7-level in May. Prelim UoM Inflation Expectations unchanged at 2.4 percent in the current month. Federal Budget Balance was at a deficit of $52.5 billion in May from a surplus of $106.5 billion in April. Euro against dollar dropped around 0.5 percent on Friday on account of strength in the dollar index coupled with mixed eco- nomic data from the region. Further, weak global market sentiments led to negative movement in the currency. German Final Consumer Price Index (CPI) unchanged at 0.3 percent in the last month. German Wholesale Price Index (WPI) gained by 0.9 percent in May as against a rise of 0.3 percent in April. French Industrial Production rose by 1.2 percent in April from a decline of 0.4 percent a month ago. Italian Industrial Production expanded by 0.5 percent in the month of April. The Sterling Pound plunged sharply around 1.44 percent in Friday’s trade on account of stronger dollar. Moreover, weak global market sentiments led to negative movement in the currency. However, favourable economic data from the country cush- ioned sharp fall in the currency. UK’s Construction Output gained by 2.5 percent in April as against a decline of 3.6 percent a month ago. Consumer Inflation Expectations rose by 2 percent in May with respect to 1.8 percent in April. SEBI Certified – Research Analyst Equities I Commodities I Currencies I Mutual Funds Last PrevCl. PriceChng PriceChng% DollarIndex 94.65 94.1 0.55 0.58 USD/INR(Spot) 66.95 66.74 0.21 0.31 USD/INR(NseJune) 66.91 66.92 (0.01) (0.01) EUR/INR(Spot) 75.34 75.50 (0.16) (0.21) EUR/INR(NseJune) 75.67 75.92 (0.25) (0.33) GBP/INR(Spot) 95.75 96.51 (0.76) (0.79) GBP/INR(NseJune) 96.52 96.84 (0.32) (0.33) JPY/INR(NseJune) 62.63 62.79 (0.16) (0.26) MarketHighlights
- 2. Technical View: The JPYINR price has been trading in rectangle pattern form past few weeks and prices are facing resistance of its upper band of channel pattern at 63 levels on hourly chart. In addition, on four hourly chart price has formed shooting star candle stick pattern , which is bearish reversal pattern. On hourly chart, momentum oscillator RSI has moved below 60 levels, which gives negative confirmation to the prices. A momentum indicator MACD has shown negative crossover on hourly chart, which indicates short term trend remains bearish. For now we expect prices to move lower towards 62.20 levels in few trading sessions. Pivot levels for the Day Technical View: The price has been trading in its rising channel formation from past few weeks and price has given breakdown of its of its lower band of channel pattern at 67.10 levels on daily chart. Price has retested the breakdown levels on 67.05 levels on daily chart. Moreover, price have been trading below of its 21 daily expo- nential moving average which suggest near term trend re- mains down. So any rally in the prices towards 67.20 level, used as selling opportunity. A momentum indicator RSI has moved below 60 levels on daily chart, which suggest bearishness in the prices. A momentum indictor MACD has given negative crossover on daily chart, which gives negative confirmation to the prices. For now we expect prices to move lower towards 66.50 lev- els in few trading sessions. Currency Highlights 13th June’2016 USDINR JPYINR SEBI Certified – Research Analyst Equities I Commodities I Currencies I Mutual Funds S3 S2 S1 Pivot R1 R2 R3 USDINR 66.62 66.79 66.85 66.96 67.02 67.13 67.30 JPYINR 62.05 62.33 62.48 62.61 62.76 62.89 63.17
- 3. Pivot levels for the Day Currency Highlights 13th June’2016 GBPINR EURINR Technical View: The pair has given breakdown of its symmetrical triangle pattern at 76.10 levels on daily chart. Now, the price has re- tested the breakdown trend line at 76.30 levels. Moreover, pair has retested the its upward trend line break- down levels of 76.50 levels on daily chart. On the other hand, Pair has been trading below its 21 daily exponential moving average which indicates that trend is remains negative. A momentum oscillator RSI have been trading below 60 lev- els on daily chart which gives the signs of bearishness to the prices. Moreover, momentum indicator MACD has shown negative crossover on daily chart which support our bearish view on the pair. For now we expect prices should move lower towards 75.50 levels in the coming trading sessions. Technical View: The prices have been moving in rising channel formation form past few weeks and price has shown breakdown of its lower band of its channel pattern at 97.20 levels on daily chart. On the other hand, Pair has been trading above its 21 daily exponential moving average which indicates that short term trend is remains bearish. A momentum indicator RSI has moved below 45 levels on daily chart, which suggest bearishness in the prices. Moreover, momentum indicator MACD has shown negative crossover on daily chart which support our bearish view on the pair. For now we expect prices should move higher towards 95.70 levels in the coming trading sessions. SEBI Certified – Research Analyst Equities I Commodities I Currencies I Mutual Funds S3 S2 S1 Pivot R1 R2 R3 GBPINR 95.65 96.15 96.33 96.65 96.83 97.15 97.65 EURINR 75.16 75.44 75.56 75.72 75.84 76.00 76.28
- 4. Currency Highlights SEBI Certified – Research Analyst Equities I Commodities I Currencies I Mutual Funds Economic Indicators Date Time Data Prior Expected Impact 13.06.16 7:30am Industrial Production y/y 6.0% 6.1% Actual > Forecast = Good for currency; Yuan 13.06.16 7:30am Fixed Asset Investment ytd/y 10.5% 10.5% Actual > Forecast = Good for currency; Yuan 13th June’2016
- 5. Currency Highlights 13th June’2016 SEBI Certified – Research Analyst Equities I Commodities I Currencies I Mutual Funds Amit Pathania Digitally signed by Amit Pathania DN: cn=Amit Pathania, o=Choice Equity Broking Pvt. ltd, ou=Research Department, email=amit.pathania@choiceindia.com, c=IN Date: 2016.06.13 08:46:42 +05'30'