
Recommended
More Related Content
What's hot
What's hot (20)
Similar to Currency high lights 23.08.16
Similar to Currency high lights 23.08.16 (20)
Recently uploaded
Recently uploaded (20)
Currency high lights 23.08.16
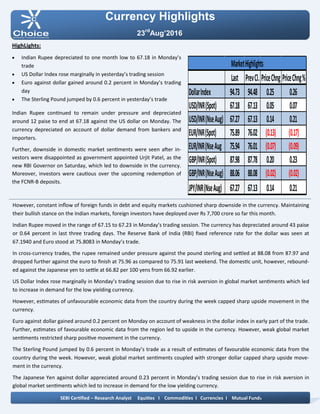
- 1. Currency Highlights 23rd Aug’2016 HighLights: Indian Rupee depreciated to one month low to 67.18 in Monday’s trade US Dollar Index rose marginally in yesterday’s trading session Euro against dollar gained around 0.2 percent in Monday’s trading day The Sterling Pound jumped by 0.6 percent in yesterday’s trade Indian Rupee continued to remain under pressure and depreciated around 12 paise to end at 67.18 against the US dollar on Monday. The currency depreciated on account of dollar demand from bankers and importers. Further, downside in domestic market sentiments were seen after in- vestors were disappointed as government appointed Urjit Patel, as the new RBI Governor on Saturday, which led to downside in the currency. Moreover, investors were cautious over the upcoming redemption of the FCNR-B deposits. However, constant inflow of foreign funds in debt and equity markets cushioned sharp downside in the currency. Maintaining their bullish stance on the Indian markets, foreign investors have deployed over Rs 7,700 crore so far this month. Indian Rupee moved in the range of 67.15 to 67.23 in Monday’s trading session. The currency has depreciated around 43 paise or 0.64 percent in last three trading days. The Reserve Bank of India (RBI) fixed reference rate for the dollar was seen at 67.1940 and Euro stood at 75.8083 in Monday’s trade. In cross-currency trades, the rupee remained under pressure against the pound sterling and settled at 88.08 from 87.97 and dropped further against the euro to finish at 75.96 as compared to 75.91 last weekend. The domestic unit, however, rebound- ed against the Japanese yen to settle at 66.82 per 100 yens from 66.92 earlier. US Dollar Index rose marginally in Monday’s trading session due to rise in risk aversion in global market sentiments which led to increase in demand for the low yielding currency. However, estimates of unfavourable economic data from the country during the week capped sharp upside movement in the currency. Euro against dollar gained around 0.2 percent on Monday on account of weakness in the dollar index in early part of the trade. Further, estimates of favourable economic data from the region led to upside in the currency. However, weak global market sentiments restricted sharp positive movement in the currency. The Sterling Pound jumped by 0.6 percent in Monday’s trade as a result of estimates of favourable economic data from the country during the week. However, weak global market sentiments coupled with stronger dollar capped sharp upside move- ment in the currency. The Japanese Yen against dollar appreciated around 0.23 percent in Monday’s trading session due to rise in risk aversion in global market sentiments which led to increase in demand for the low yielding currency. SEBI Certified – Research Analyst Equities I Commodities I Currencies I Mutual Funds Last PrevCl. PriceChng PriceChng% DollarIndex 94.73 94.48 0.25 0.26 USD/INR(Spot) 67.18 67.13 0.05 0.07 USD/INR(NseAug) 67.27 67.13 0.14 0.21 EUR/INR(Spot) 75.89 76.02 (0.13) (0.17) EUR/INR(NseAug 75.94 76.01 (0.07) (0.09) GBP/INR(Spot) 87.98 87.78 0.20 0.23 GBP/INR(NseAug) 88.06 88.08 (0.02) (0.02) JPY/INR(NseAug) 67.27 67.13 0.14 0.21 MarketHighlights
- 2. Technical View: The price has given breakout of its falling trend at 65.80 levels on daily chart. Price has shown breakout of horizontal trend line at 66.75 levels on daily chart. Moreover, prices have been trading above its 21 DEMA on daily chart, which indicates short term trend remains up. On daily chart, momentum oscillator RSI has moved above 60 levels, which gives positive confirmation to the prices. A momentum indicator MACD has shown positive crossover on daily hourly chart, which indicates further bullishness in the prices. For now we expect prices to move higher towards 67.40 lev- els in few trading sessions. Pivot levels for the Day Technical View: The price has given breakout of its falling wedge pattern at 67.10 levels on daily chart with bolstering volumes. On the other hand price have given breakout of horizontal trend line at 67.05 levels on daily chart. Moreover, price have been trading above its 21 daily expo- nential moving average which suggest short term trend is bullish. So any dip in the prices towards 67.15 level, used as buying opportunity. A momentum indicator RSI has moved above 45 levels on daily chart, which suggest bullishness in the prices. A momentum indictor MACD has given positive crossover on daily chart, which gives positive confirmation to the prices. For now we expect prices to move higher towards 67.65 lev- els in few trading sessions. Currency Highlights 23rd Aug’2016 USDINR JPYINR SEBI Certified – Research Analyst Equities I Commodities I Currencies I Mutual Funds S3 S2 S1 Pivot R1 R2 R3 USDINR 67.05 67.16 67.21 67.27 67.32 67.38 67.49 JPYINR 66.31 66.53 66.67 66.75 66.89 66.97 67.19
- 3. Pivot levels for the Day Currency Highlights 23rd Aug’2016 GBPINR EURINR Technical View: The prices have been trading in descending triangle pattern from past few weeks and prices has taken support of its low- er band of triangle pattern at 74 levels on daily chart. On the other hand, Pair has been trading above its 21 daily exponential moving average which indicates that trend is turned into bullish. A momentum oscillator RSI have been trading above 45 lev- els on daily chart which gives the signs of bullishness to the prices. Moreover, momentum indicator MACD has shown bullish sign on daily chart which support our bullish view on the pair. For now we expect prices should move higher towards 76.60 levels in the coming trading sessions. Technical View: The price has been trading in descending triangle formation from past weeks and prices have been facing resistance of its upper bad of triangle at 88.20 levels on daily chart. The prices have been trading below its 21 DEMA, which sug- gest short term trend is down. A momentum indicator RSI has remained below 50 levels on daily chart, which suggest bearishness in the prices. Moreover, momentum indicator MACD has shown negative sign on daily chart which support our bearish view on the pair. For now we expect prices should move lower towards 87.30 levels in the coming trading sessions. SEBI Certified – Research Analyst Equities I Commodities I Currencies I Mutual Funds S3 S2 S1 Pivot R1 R2 R3 GBPINR 86.86 87.43 87.75 88.00 88.32 88.57 89.14 EURINR 75.50 75.70 75.81 75.90 76.01 76.10 76.30
- 4. Currency Highlights SEBI Certified – Research Analyst Equities I Commodities I Currencies I Mutual Funds Economic Indicators Date Time Data Prior Expected Impact 23.08.16 9:30 AM BOJ Gov Kuroda Speaks 23.08.16 12:30 PM French Flash Manufacturing PMI 48.6 49.1 Actual > Forecast = Good for currency; EURINR 23.08.16 12:30 PM French Flash Services PMI 50.5 50.6 Actual > Forecast = Good for currency; EURINR 23.08.16 1:00 PM German Flash Manufacturing PMI 53.8 53.7 Actual > Forecast = Good for currency; EURINR 23.08.16 1:00 PM German Flash Services PMI 54.4 54.3 Actual > Forecast = Good for currency; EURINR 23.08.16 1:30 PM Flash Manufacturing PMI 52.0 52.1 Actual > Forecast = Good for currency; EURINR 23.08.16 1:30 PM Flash Services PMI 52.9 53.0 Actual > Forecast = Good for currency; EURINR 23.08.16 7:30 PM New Home Sales 592K 575K Actual > Forecast = Good for currency; EURINR 23rd Aug’2016
- 5. Currency Highlights 23rd Aug’2016 SEBI Certified – Research Analyst Equities I Commodities I Currencies I Mutual Funds Amit Pathania Digitally signed by Amit Pathania DN: cn=Amit Pathania, o=Choice Equity Broking Pvt. ltd, ou=Research Department, email=amit.pathania@choiceindia.com, c=IN Date: 2016.08.23 08:48:54 +05'30'