WhatsApp 📞 Call : 9892124323 ✅Call Girls In Chembur ( Mumbai ) secure service
Currency high lights 18.01.17
1. Currency Highlights
18th
Jan’2017
HighLights:
Indian Rupee rose to 2-week high at 67.96 in Tuesday’s trade
US Empire State Manufacturing Index fell to 6.5-mark in Jan
Euro Zone ZEW Economic Sentiment rose to 23.2-level in Jan
UK’s Consumer Price Index (CPI) grew by 1.6 percent in Dec
Indian Rupee rose to two week high and appreciated around 14 paise
to end at 67.96 against the US dollar on Tuesday. The currency appre-
ciated on account of selling of dollars from exporters and banks.
However, outflow of foreign funds from selling in equities by the insti-
tutional investors capped gains in the currency. So far this year, for-
eign institutional investors have sold $474.50 million and $262.50 mil-
lion in equity and debt respectively. Further, weak domestic market
sentiments capped sharp gains in the currency. Investors remained
cautious ahead of British Prime Minister Theresa May’s speech on
Brexit plans due later in the day, as well as President-elect Donald
Trump’s inauguration stateside at the end of the week.
Indian Rupee moved in the range of 67.94 to 68.14 in Tuesday’s trade. The Reserve Bank of India (RBI) fixed reference rate for
the dollar was seen at 68.0509 and Euro stood at 72.5014 as on 17th Jan’17.
For the month of January 2017, FII outflows in equities totalled at Rs.4250.32 crores ($624.10 million) as on 17thJanuary 2017.
Year to date basis, net capital outflows stood at Rs.4250.32 crores ($624.10 million) as on 17thJanuary 2017.
US Dollar Index dropped around 0.86 percent in Tuesday’s trading session due to unfavourable economic data from the coun-
try. However, rise in risk aversion in global market sentiments which led to increase in demand for the low yielding currency
cushioned sharp negative movement in the currency. US Empire State Manufacturing Index plunged by 2.5 points to 6.5-mark
in January as against a rise of 9-level in December.
Euro against dollar grew by more than 1 percent on Tuesday on account of weakness in the dollar index coupled with favoura-
ble economic data from the region. However, weak global market sentiments capped sharp gains in the currency. German
ZEW Economic Sentiment surged by 2.8 points to 16.6-mark in January as against a rise of 13.8-level in December. Euro Zone
ZEW Economic Sentiment increased by 5.1 points to 23.2-level in current month from 18.1-mark in December.
The Sterling Pound surged by more than 3 percent in Tuesday’s trade after Britain Prime Minister Theresa May gave a clear
and adamant view on Britain exiting from the European Union along with promise for a vote in Parliament on the final Brexit
deal. Further, optimistic economic data from the country led to positive movement in the currency.
UK’s Consumer Price Index (CPI) grew by 1.6 percent in December as against a rise of 1.2 percent in November. Producer Price
Index (PPI) Input increased by 1.8 percent in December from a drop of 0.6 percent in November. Retail Price Index (RPI) ex-
panded by 2.5 percent in December with respect to 2.2 percent a month ago.
The Japanese Yen against dollar appreciated around 1.4 percent in Tuesday’s trading session due to rise in risk aversion in
global market sentiments which led to increase in demand for the low yielding currency.
SEBI Certified – Research Analyst Equities I Commodities I Currencies I Mutual Funds
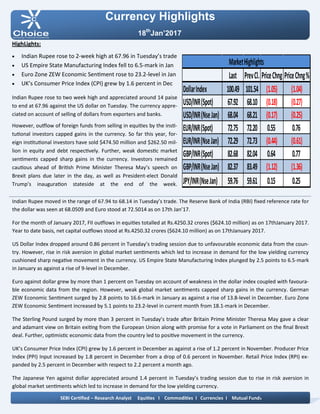
Last PrevCl. PriceChng PriceChng%
DollarIndex 100.49 101.54 (1.05) (1.04)
USD/INR(Spot) 67.92 68.10 (0.18) (0.27)
USD/INR(NseJan) 68.04 68.21 (0.17) (0.25)
EUR/INR(Spot) 72.75 72.20 0.55 0.76
EUR/INR(NseJan) 72.29 72.73 (0.44) (0.61)
GBP/INR(Spot) 82.68 82.04 0.64 0.77
GBP/INR(NseJan) 82.37 83.49 (1.12) (1.36)
JPY/INR(NseJan) 59.76 59.61 0.15 0.25
MarketHighlights
2. Technical View:
On daily chart, it has been observed that the JPYINR has
completed a Bullish Bat harmonic pattern at 57.55 levels
the coordinates of which are as follows:
The pair has given breakout of its horizontal pattern at
59.20 levels on daily chart.
Moreover, prices have been trading below its 50 DSMA
which gives the sign of bullishness in the prices.
On daily chart momentum indicator RSI is trading above
50 levels which indicates up side momentum can be
seen in the prices.
In addition, momentum indicator MACD has shown posi-
tive crossover which suggest possibilities of rebound in
the prices on daily chart.
So for trading perspective, one could JPYINR buy in the
range of 60 with SL of 59.70 for target of 60.50 levels.
Pivot levels for the Day
Technical View:
The pair has been moving in its rising channel pattern
and prices have been facing resistance of its upper band
of channel pattern at 68.60 levels on hourly chart.
The price has faced resistance of its horizontal trend line
at 68.40 levels on hourly chart.
Moreover, prices have been trading below its 21 HSMA
which gives the sign of bullishness in the prices.
A momentum indicator RSI has shown bearish range
shift at 58 levels, which suggest further negative mo-
mentum can be seen in the prices.
In addition, momentum indicator MACD has shown
negative crossover on hourly chart.
So for trading perspective, one could sell USDINR in
range 68.15 with SL of 68.40 for target of 67.60.
Currency Highlights
18th
Jan’2017
USDINR JPYINR
SEBI Certified – Research Analyst Equities I Commodities I Currencies I Mutual Funds
S3 S2 S1 Pivot R1 R2 R3
USDINR 67.68 67.89 67.96 68.10 68.17 68.31 68.52
JPYINR 59.02 59.56 59.92 60.10 60.46 60.64 61.18
3. Pivot levels for the Day
Currency Highlights
18th
Jan’2017
GBPINR EURINR
Technical View:
The price has taken support of its horizontal trend line
at 71.80 levels on daily chart. The EURINR pair has also
taken support of its falling trend line at 70.70 levels on
daily chart.
The pair has been trading above its 21 DSMA on daily
chart, which suggest further bullishness can be seen in
the prices.
On daily chart momentum oscillator RSI has been mov-
ing above 50 levels on daily chart, which suggest bullish-
ness in the prices.
A momentum indicator MACD has shown positive cross-
over on daily chart, which support our bullish view to
the prices.
For now we can expect prices should move higher to-
wards 73.30 levels in the coming trading session.
Technical View:
The prices has been facing resistance of its falling trend
line at 84.20 levels on hourly chart.
The price have shown breakdown of its rising channel
pattern at 83.60 levels on hourly chart and price has
rested its channel breakdown trend line at 83.50 levels.
Moreover, prices have been trading below 21 HSMA,
which suggest short term trend looks weak.
Moreover, momentum indicator MACD has given nega-
tive cross over on hourly chart, which gives the sign of
bearishness in the prices.
The momentum indictor RSI has been trading below 60
levels on hourly chart, which suggest the possibilities of
further downside momentum in the prices.
For now we expect prices should move lower towards
81.90 levels coming trading sessions.
SEBI Certified – Research Analyst Equities I Commodities I Currencies I Mutual Funds
S3 S2 S1 Pivot R1 R2 R3
GBPINR 81.46 82.07 82.44 82.68 83.05 83.29 83.90
EURINR 71.79 72.23 72.51 72.67 72.95 73.11 73.55
4. Currency Highlights
SEBI Certified – Research Analyst Equities I Commodities I Currencies I Mutual Funds
18th
Jan’2017
Economic Indicators
Date Time Data Prior Expected Impact
18.01.17 03;00 PM Average Earnings Index 3m/y 2.5% 2.6% Actual > Forecast = Good for
currency; GBPINR
18.01.17 03;00 PM Claimant Count Change 2.4k 4.6k Actual < Forecast = Good for
currency; GBPINR
18.01.17 07:00 PM CPI m/m 0.2% 0.3% Actual > Forecast = Good for
currency; GBPINR
18.01.17 07:00 PM Core CPI m/m 0.2% 0.2% Actual > Forecast = Good for
currency; GBPINR
5. Currency Highlights
18th
Jan’2017
SEBI Certified – Research Analyst Equities I Commodities I Currencies I Mutual Funds
Anish Vyas
Digitally signed by Anish Vyas
DN: cn=Anish Vyas, o=Choice Merchandise
Broking Pvt. Ltd, ou=Sr. Research Associate,
email=anish.vyas@choiceindia.com, c=IN
Date: 2017.01.18 08:46:57 +05'30'