VIP Call Girl in Mumbai Central 💧 9920725232 ( Call Me ) Get A New Crush Ever...
Currency high lights 08.07.16
1. Currency Highlights
08th
July’2016
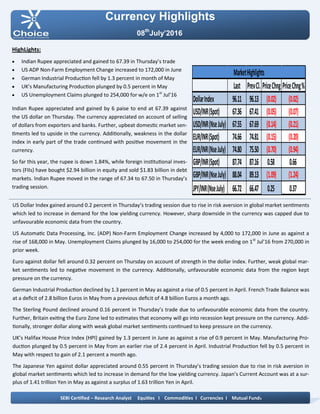
HighLights:
Indian Rupee appreciated and gained to 67.39 in Thursday’s trade
US ADP Non-Farm Employment Change increased to 172,000 in June
German Industrial Production fell by 1.3 percent in month of May
UK’s Manufacturing Production plunged by 0.5 percent in May
US Unemployment Claims plunged to 254,000 for w/e on 1st
Jul’16
Indian Rupee appreciated and gained by 6 paise to end at 67.39 against
the US dollar on Thursday. The currency appreciated on account of selling
of dollars from exporters and banks. Further, upbeat domestic market sen-
timents led to upside in the currency. Additionally, weakness in the dollar
index in early part of the trade continued with positive movement in the
currency.
So far this year, the rupee is down 1.84%, while foreign institutional inves-
tors (FIIs) have bought $2.94 billion in equity and sold $1.83 billion in debt
markets. Indian Rupee moved in the range of 67.34 to 67.50 in Thursday’s
trading session.
US Dollar Index gained around 0.2 percent in Thursday‘s trading session due to rise in risk aversion in global market sentiments
which led to increase in demand for the low yielding currency. However, sharp downside in the currency was capped due to
unfavourable economic data from the country.
US Automatic Data Processing, Inc. (ADP) Non-Farm Employment Change increased by 4,000 to 172,000 in June as against a
rise of 168,000 in May. Unemployment Claims plunged by 16,000 to 254,000 for the week ending on 1st
Jul’16 from 270,000 in
prior week.
Euro against dollar fell around 0.32 percent on Thursday on account of strength in the dollar index. Further, weak global mar-
ket sentiments led to negative movement in the currency. Additionally, unfavourable economic data from the region kept
pressure on the currency.
German Industrial Production declined by 1.3 percent in May as against a rise of 0.5 percent in April. French Trade Balance was
at a deficit of 2.8 billion Euros in May from a previous deficit of 4.8 billion Euros a month ago.
The Sterling Pound declined around 0.16 percent in Thursday’s trade due to unfavourable economic data from the country.
Further, Britain exiting the Euro Zone led to estimates that economy will go into recession kept pressure on the currency. Addi-
tionally, stronger dollar along with weak global market sentiments continued to keep pressure on the currency.
UK’s Halifax House Price Index (HPI) gained by 1.3 percent in June as against a rise of 0.9 percent in May. Manufacturing Pro-
duction plunged by 0.5 percent in May from an earlier rise of 2.4 percent in April. Industrial Production fell by 0.5 percent in
May with respect to gain of 2.1 percent a month ago.
The Japanese Yen against dollar appreciated around 0.55 percent in Thursday’s trading session due to rise in risk aversion in
global market sentiments which led to increase in demand for the low yielding currency. Japan’s Current Account was at a sur-
plus of 1.41 trillion Yen in May as against a surplus of 1.63 trillion Yen in April.
SEBI Certified – Research Analyst Equities I Commodities I Currencies I Mutual Funds
Last PrevCl. PriceChng PriceChng%
DollarIndex 96.11 96.13 (0.02) (0.02)
USD/INR(Spot) 67.36 67.41 (0.05) (0.07)
USD/INR(NseJuly) 67.55 67.69 (0.14) (0.21)
EUR/INR(Spot) 74.66 74.81 (0.15) (0.20)
EUR/INR(NseJuly) 74.80 75.50 (0.70) (0.94)
GBP/INR(Spot) 87.74 87.16 0.58 0.66
GBP/INR(NseJuly) 88.04 89.13 (1.09) (1.24)
JPY/INR(NseJuly) 66.72 66.47 0.25 0.37
MarketHighlights
2. Technical View:
The pair have been trading in rising channel pattern and pric-
es have been facing resistance of its upper band of channel
pattern 67.80 levels on daily chart.
In addition, on daily chart prices have been trading below its
15 hourly exponential moving average which gives the nega-
tive confirmation to the prices.
On daily chart, momentum oscillator RSI has remained above
its overbought zone 70 levels, which gives negative confirma-
tion to the prices.
A momentum indicator MACD has shown negative crossover
on daily chart, which indicates short term trend remains bear-
ish.
For now we expect prices to move lower towards 66.10 levels
in few trading sessions.
Pivot levels for the Day
Technical View:
The price has been trading in its rising channel formation
from past few months and price has faced resistance of its
upper band at 68.50 levels on daily chart. Price has faced re-
sistance of its horizontal trend line at 68 levels on daily.
Moreover, price have been trading below its 15 daily expo-
nential moving average which suggest near term remains
down. So any rally in the prices towards 67.85 level, used as
selling opportunity.
A momentum indicator RSI has moved below 60 levels on
daily chart, which suggest bearishness in the prices.
A momentum indictor MACD has given negative signs on dai-
ly chart, which gives negative confirmation to the prices.
For now we expect prices to move lower towards 67.10 lev-
els in few trading sessions.
Currency Highlights
08th
July’2016
USDINR JPYINR
SEBI Certified – Research Analyst Equities I Commodities I Currencies I Mutual Funds
S3 S2 S1 Pivot R1 R2 R3
USDINR 66.87 67.26 67.41 67.65 67.80 68.04 68.43
JPYINR 65.87 66.36 66.55 66.85 67.04 67.34 67.83
3. Pivot levels for the Day
Currency Highlights
08th
July’2016
GBPINR EURINR
Technical View:
The price has shown breakout of its symmetrical triangle
patter at 75.50 levels on daily chart. he price has shown
breakdown of its rising channel pattern at 75.50 levels on
daily chart.
On the other hand, Pair has been trading below its 21 daily
exponential moving average which indicates that trend is
remains down.
A momentum oscillator RSI have been trading below 45 lev-
els on daily chart which gives the signs of bearishness to the
prices.
Moreover, momentum indicator MACD has shown negative
crossover on daily chart which support our bearish view on
the pair.
For now we expect prices should move lower towards 74.20
levels in the coming trading sessions.
Technical View:
The price has shown breakdown of its horizontal channel
pattern at 94 levels on daily chart. The pair has shown break-
down of its falling channel pattern at 91 levels on daily chart.
So any rally in the prices towards 89 level, used as selling op-
portunity.
On the other hand, pair has been trading below its 50 daily
exponential moving average which indicates that short term
trend is remains bearish.
The price has given breakdown of its horizontal trend line at
89 levels on daily chart.
A momentum indicator RSI has moved below 45 levels on
daily chart, which suggest bearishness in the prices.
Moreover, momentum indicator MACD has shown negative
crossover on daily chart which support our bearish view on
the pair.
SEBI Certified – Research Analyst Equities I Commodities I Currencies I Mutual Funds
S3 S2 S1 Pivot R1 R2 R3
GBPINR 85.96 87.02 87.53 88.08 88.59 89.14 90.20
EURINR 74.19 74.56 74.72 74.93 75.09 75.30 75.67
4. Currency Highlights
SEBI Certified – Research Analyst Equities I Commodities I Currencies I Mutual Funds
Economic Indicators
Date Time Data Prior Expected Impact
08.07.16 5:20am Current Account 1.63T 1.52T Actual > Forecast = Good for
currency; JPYINR
08.07.16 2:00pm Goods Trade Balance -10.5B -10.2B Actual > Forecast = Good for
currency; GBPINR
08.07.16 6:00pm Average Hourly Earnings m/m 0.2% 0.2% Actual > Forecast = Good for
currency; USDINR
08.07.16 6:00pm Non-Farm Employment Change 38K 174K Actual > Forecast = Good for
currency; USDINR
08.07.16 6:00pm Unemployment Rate 4.7% 4.8% Actual < Forecast = Good for
currency; USDINR
08th
July’2016
5. Currency Highlights
08th
July’2016
SEBI Certified – Research Analyst Equities I Commodities I Currencies I Mutual Funds
Amit Pathania
Digitally signed by Amit Pathania
DN: cn=Amit Pathania, o=Choice Equity Broking Pvt. ltd, ou=Research
Department, email=amit.pathania@choiceindia.com, c=IN
Date: 2016.07.08 08:51:56 +05'30'