NO1 Popular Black Magic Specialist Expert Amil baba in Norway Poland Portugal...
Currency high lights 19.07.16
1. Currency Highlights
19th
July’2016
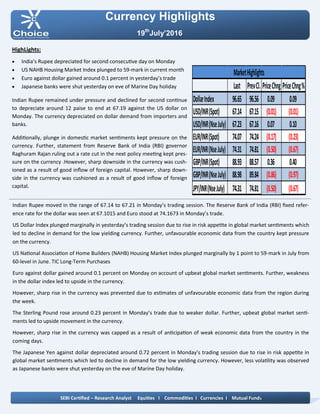
HighLights:
India’s Rupee depreciated for second consecutive day on Monday
US NAHB Housing Market Index plunged to 59-mark in current month
Euro against dollar gained around 0.1 percent in yesterday’s trade
Japanese banks were shut yesterday on eve of Marine Day holiday
Indian Rupee remained under pressure and declined for second continue
to depreciate around 12 paise to end at 67.19 against the US dollar on
Monday. The currency depreciated on dollar demand from importers and
banks.
Additionally, plunge in domestic market sentiments kept pressure on the
currency. Further, statement from Reserve Bank of India (RBI) governor
Raghuram Rajan ruling out a rate cut in the next policy meeting kept pres-
sure on the currency .However, sharp downside in the currency was cush-
ioned as a result of good inflow of foreign capital. However, sharp down-
side in the currency was cushioned as a result of good inflow of foreign
capital.
Indian Rupee moved in the range of 67.14 to 67.21 in Monday’s trading session. The Reserve Bank of India (RBI) fixed refer-
ence rate for the dollar was seen at 67.1015 and Euro stood at 74.1673 in Monday’s trade.
US Dollar Index plunged marginally in yesterday’s trading session due to rise in risk appetite in global market sentiments which
led to decline in demand for the low yielding currency. Further, unfavourable economic data from the country kept pressure
on the currency.
US National Association of Home Builders (NAHB) Housing Market Index plunged marginally by 1 point to 59-mark in July from
60-level in June. TIC Long-Term Purchases
Euro against dollar gained around 0.1 percent on Monday on account of upbeat global market sentiments. Further, weakness
in the dollar index led to upside in the currency.
However, sharp rise in the currency was prevented due to estimates of unfavourable economic data from the region during
the week.
The Sterling Pound rose around 0.23 percent in Monday’s trade due to weaker dollar. Further, upbeat global market senti-
ments led to upside movement in the currency.
However, sharp rise in the currency was capped as a result of anticipation of weak economic data from the country in the
coming days.
The Japanese Yen against dollar depreciated around 0.72 percent in Monday’s trading session due to rise in risk appetite in
global market sentiments which led to decline in demand for the low yielding currency. However, less volatility was observed
as Japanese banks were shut yesterday on the eve of Marine Day holiday.
SEBI Certified – Research Analyst Equities I Commodities I Currencies I Mutual Funds
Last PrevCl. PriceChng PriceChng%
DollarIndex 96.65 96.56 0.09 0.09
USD/INR(Spot) 67.14 67.15 (0.01) (0.01)
USD/INR(NseJuly) 67.23 67.16 0.07 0.10
EUR/INR(Spot) 74.07 74.24 (0.17) (0.23)
EUR/INR(NseJuly) 74.31 74.81 (0.50) (0.67)
GBP/INR(Spot) 88.93 88.57 0.36 0.40
GBP/INR(NseJuly) 88.98 89.84 (0.86) (0.97)
JPY/INR(NseJuly) 74.31 74.81 (0.50) (0.67)
MarketHighlights
2. Technical View:
The pair have been taking support of its horizontal trend line
at 63.20 levels on daily chart. The pair has been taking sup-
port of its lower band of channel pattern at 63 levels on daily
chart.
In addition, on daily chart prices have been trading above its
50 daily exponential moving average which gives the positive
confirmation to the prices.
Moreover, price has been taking support of its 61.80% Fibo-
nacci retracement levels t 63.20 levels on daily .
On daily chart, momentum oscillator RSI has moved above
40 levels, which gives positive confirmation to the prices.
A momentum indicator MACD has shown positive sign on
daily chart, which indicates short term trend remains bullish.
For now we expect prices to move higher towards 64.10 lev-
els in few trading sessions.
Pivot levels for the Day
Technical View:
The prices have been taking support of its rising trend line at
67 levels on daily chart. Price has formed bullish engulfing
pattern on daily chart. The USDINR has been trading in rising
channel pattern and taking support of its lower band of chan-
nel pattern at 66.90 levels on daily chart.
Moreover, price have been trading above its 200 daily expo-
nential moving average which suggest near term remains up.
So any dip in the prices towards 67 level, used as buying op-
portunity.
A momentum indicator RSI has moved above 40 levels on
daily chart, which suggest bullishness in the prices.
A momentum indictor MACD has given positive crossover on
4 hourly chart, which gives negative confirmation to the pric-
es.
For now we expect prices to move higher towards 67.70 lev-
els in few trading sessions.
Currency Highlights
19th
July’2016
USDINR JPYINR
SEBI Certified – Research Analyst Equities I Commodities I Currencies I Mutual Funds
S3 S2 S1 Pivot R1 R2 R3
USDINR 66.88 67.04 67.14 67.20 67.30 67.36 67.52
JPYINR 62.87 63.26 63.46 63.65 63.85 64.04 64.43
3. Pivot levels for the Day
Currency Highlights
19th
July’2016
GBPINR EURINR
Technical View:
The price has given breakdown of its rising trend line at
74.50 levels and price has retested the breakdown trend line
at 74.60 levels on daily chart.
On the other hand, Pair has been trading below its 50 daily
exponential moving average which indicates that trend is
remains up.
A momentum oscillator RSI have been trading below 40 lev-
els on daily chart which gives the signs of bearishness to the
prices.
Moreover, momentum indicator MACD has shown negative
crossover on daily chart which support our bearish view on
the pair.
For now we expect prices should move lower towards 73.70
levels in the coming trading sessions.
Technical View:
The price has formed bullish hammer candle stick pattern on
daily which is bullish pattern. Price has been falling trend
line at 89 levels on daily chart.
The pair has taken support of its horizontal trend line at
88.60 levels.
The price has completed bullish AB=CD harmonic pattern on
daily chart 87.20 levels.
A momentum indicator RSI has moved in oversold zone at
27 levels on daily chart, which suggest bullishness in the
prices.
Moreover, momentum indicator MACD has shown positive
sign on daily chart which support our bullish view on the
pair.
For now we expect prices should move higher towards 90.60
levels in the coming trading sessions.
SEBI Certified – Research Analyst Equities I Commodities I Currencies I Mutual Funds
S3 S2 S1 Pivot R1 R2 R3
GBPINR 87.95 88.48 88.72 89.01 89.25 89.54 90.07
EURINR 73.83 74.08 74.18 74.33 74.43 74.58 74.83
4. Currency Highlights
SEBI Certified – Research Analyst Equities I Commodities I Currencies I Mutual Funds
Economic Indicators
Date Time Data Prior Expected Impact
19.07.16 2:00pm CPI y/y 0.3% 0.4% Actual > Forecast = Good for
currency; GBPINR
19.07.16 2:00pm PPI Input m/m 2.6% 0.9% Actual > Forecast = Good for
currency; GBPINR
19.07.16 2:00pm RPI y/y 1.4% 1.4% Actual > Forecast = Good for
currency; GBPINR
19.07.16 2:30pm German ZEW Economic Senti-
ment
19.2 8.2 Actual > Forecast = Good for
currency; EURINR
19.07.16 2:30pm ZEW Economic Sentiment 20.2 12.3 Actual > Forecast = Good for
currency; EURINR
19.07.16 6:00pm Building Permits 1.14M 1.15M Actual > Forecast = Good for
currency; USDINR
19.07.16 6:00pm Housing Starts 1.16M 1.17M Actual > Forecast = Good for
currency; USDINR
19.07.16 7:35pm MPC Member Broadbent
Speaks
19th
July’2016
5. Currency Highlights
19th
July’2016
SEBI Certified – Research Analyst Equities I Commodities I Currencies I Mutual Funds
Amit Pathania
Digitally signed by Amit Pathania
DN: cn=Amit Pathania, o=Choice Equity Broking Pvt. ltd, ou=Research
Department, email=amit.pathania@choiceindia.com, c=IN
Date: 2016.07.19 08:44:06 +05'30'