amil baba in australia amil baba in canada amil baba in london amil baba in g...
Currency high lights 21.12.16
1. Currency Highlights
21st
Dec’2016
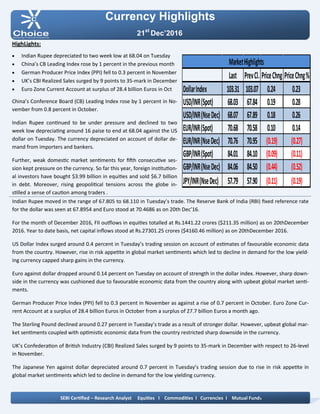
HighLights:
Indian Rupee depreciated to two week low at 68.04 on Tuesday
China’s CB Leading Index rose by 1 percent in the previous month
German Producer Price Index (PPI) fell to 0.3 percent in November
UK’s CBI Realized Sales surged by 9 points to 35-mark in December
Euro Zone Current Account at surplus of 28.4 billion Euros in Oct
China’s Conference Board (CB) Leading Index rose by 1 percent in No-
vember from 0.8 percent in October.
Indian Rupee continued to be under pressure and declined to two
week low depreciating around 16 paise to end at 68.04 against the US
dollar on Tuesday. The currency depreciated on account of dollar de-
mand from importers and bankers.
Further, weak domestic market sentiments for fifth consecutive ses-
sion kept pressure on the currency. So far this year, foreign institution-
al investors have bought $3.99 billion in equities and sold $6.7 billion
in debt. Moreover, rising geopolitical tensions across the globe in-
stilled a sense of caution among traders .
Indian Rupee moved in the range of 67.805 to 68.110 in Tuesday’s trade. The Reserve Bank of India (RBI) fixed reference rate
for the dollar was seen at 67.8954 and Euro stood at 70.4686 as on 20th Dec’16.
For the month of December 2016, FII outflows in equities totalled at Rs.1441.22 crores ($211.35 million) as on 20thDecember
2016. Year to date basis, net capital inflows stood at Rs.27301.25 crores ($4160.46 million) as on 20thDecember 2016.
US Dollar Index surged around 0.4 percent in Tuesday’s trading session on account of estimates of favourable economic data
from the country. However, rise in risk appetite in global market sentiments which led to decline in demand for the low yield-
ing currency capped sharp gains in the currency.
Euro against dollar dropped around 0.14 percent on Tuesday on account of strength in the dollar index. However, sharp down-
side in the currency was cushioned due to favourable economic data from the country along with upbeat global market senti-
ments.
German Producer Price Index (PPI) fell to 0.3 percent in November as against a rise of 0.7 percent in October. Euro Zone Cur-
rent Account at a surplus of 28.4 billion Euros in October from a surplus of 27.7 billion Euros a month ago.
The Sterling Pound declined around 0.27 percent in Tuesday’s trade as a result of stronger dollar. However, upbeat global mar-
ket sentiments coupled with optimistic economic data from the country restricted sharp downside in the currency.
UK’s Confederation of British Industry (CBI) Realized Sales surged by 9 points to 35-mark in December with respect to 26-level
in November.
The Japanese Yen against dollar depreciated around 0.7 percent in Tuesday’s trading session due to rise in risk appetite in
global market sentiments which led to decline in demand for the low yielding currency.
SEBI Certified – Research Analyst Equities I Commodities I Currencies I Mutual Funds
Last PrevCl. PriceChng PriceChng%
DollarIndex 103.31 103.07 0.24 0.23
USD/INR(Spot) 68.03 67.84 0.19 0.28
USD/INR(NseDec) 68.07 67.89 0.18 0.26
EUR/INR(Spot) 70.68 70.58 0.10 0.14
EUR/INR(NseDec) 70.76 70.95 (0.19) (0.27)
GBP/INR(Spot) 84.01 84.10 (0.09) (0.11)
GBP/INR(NseDec) 84.06 84.50 (0.44) (0.52)
JPY/INR(NseDec) 57.79 57.90 (0.11) (0.19)
MarketHighlights
2. Technical View:
On daily chart JPYINR price has shown breakdown of its
falling wedge pattern at 62 levels. The price has given
breakdown of its horizontal trend line at 58.50 levels on
daily chart.
Moreover, prices have been trading below its 21 DEMA
which gives the sign of bearishness in the prices.
On daily chart momentum indicator RSI is trading below
40 levels which suggest further weakness can be seen in
the prices.
In addition, momentum indicator MACD has shown neg-
ative crossover and remained below signal line on daily
chart.
So for trading perspective, one could JPYINR sell in the
range of 57.95 with SL of 58.30 for target of 57.30 levels.
Pivot levels for the Day
Technical View:
The pair has shown breakout of its falling trend line at
67.50 levels on daily chart. On daily chart USDINR price
has retested its falling trend line at 67.20 levels.
On daily chart price has taken support of its 61.80% Fib-
onacci retracement levels.
Moreover, prices have been trading above its 50 DEMA
which gives the sign of bullishness in the prices.
A momentum indicator RSI has been trading above 40
levels, which suggest further positive momentum can be
seen in the prices.
In addition, momentum indicator MACD has shown
positive crossover on hourly chart.
So for trading perspective, one could buy USDINR in
range 67.90 with SL of 67.60 for target of 68.40.
Currency Highlights
21st
Dec’2016
USDINR JPYINR
SEBI Certified – Research Analyst Equities I Commodities I Currencies I Mutual Funds
S3 S2 S1 Pivot R1 R2 R3
USDINR 67.50 67.75 67.90 68.00 68.15 68.25 68.50
JPYINR 56.83 57.29 57.53 57.75 57.99 58.21 58.67
3. Pivot levels for the Day
Currency Highlights
21st
Dec’2016
GBPINR EURINR
Technical View:
The price has shown breakdown of its falling channel a
pattern at 72 levels on daily chart. The EURINR pair has
shown horizontal trend line at 72.50 levels on daily
chart.
The pair has been trading below its 21 DEMA on daily
chart, which suggest further weakness can be seen in
the prices.
On daily chart momentum oscillator RSI has remained
below 50 which suggest bearishness in the prices.
A momentum indicator MACD has shown negative
crossover on daily chart, which add more bearishness
in the prices.
For now we can expect prices should move lower to-
wards 70.15 levels in the coming trading session.
Technical View:
The price has shown breakdown of its rising channel
pattern at 85 levels on daily chart. The pair has been
facing resistance of its falling trend line at 86.10 levels
on daily chart. The prices have been facing resistance of
its horizontal line at 86 levels.
Moreover, prices have been trading below 50 DEMA,
which suggest short term trend looks negative.
Moreover, momentum indicator MACD has given nega-
tive cross over on daily chart, which gives the sign of
bearishness in the prices.
The momentum indictor RSI has been trading below 60
levels on daily chart, which suggest the possibilities of
further weakness in the prices.
For now we expect prices should move lower towards
83.60 levels coming trading sessions.
SEBI Certified – Research Analyst Equities I Commodities I Currencies I Mutual Funds
S3 S2 S1 Pivot R1 R2 R3
GBPINR 83.49 83.81 83.94 84.13 84.26 84.45 84.77
EURINR 70.09 70.41 70.58 70.73 70.90 71.05 71.37
4. Currency Highlights
SEBI Certified – Research Analyst Equities I Commodities I Currencies I Mutual Funds
21st
Dec’2016
Economic Indicators
Date Time Data Prior Expected Impact
21.12.16 08:30 PM Consumer Confidence -6 -6 Actual > Forecast = Good
for currency; EURINR
21.12.16 08:30 PM Existing Home Sales 5.60M 5.52M Actual > Forecast = Good
for currency; USDINR
21.12.16 09:00 PM Crude Oil Inventories -2.6M
5. Currency Highlights
21st
Dec’2016
SEBI Certified – Research Analyst Equities I Commodities I Currencies I Mutual Funds
Anish Vyas
Digitally signed by Anish Vyas
DN: cn=Anish Vyas, o=Choice Merchandise
Broking Pvt. Ltd, ou=Sr. Research Associate,
email=anish.vyas@choiceindia.com, c=IN
Date: 2016.12.21 08:25:15 +05'30'