
Recommended
More Related Content
What's hot
What's hot (20)
Similar to Currency high lights 22.08.16
Similar to Currency high lights 22.08.16 (20)
Recently uploaded
Recently uploaded (20)
Currency high lights 22.08.16
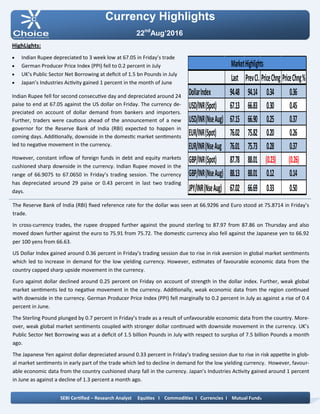
- 1. Currency Highlights 22nd Aug’2016 HighLights: Indian Rupee depreciated to 3 week low at 67.05 in Friday’s trade German Producer Price Index (PPI) fell to 0.2 percent in July UK’s Public Sector Net Borrowing at deficit of 1.5 bn Pounds in July Japan’s Industries Activity gained 1 percent in the month of June Indian Rupee fell for second consecutive day and depreciated around 24 paise to end at 67.05 against the US dollar on Friday. The currency de- preciated on account of dollar demand from bankers and importers. Further, traders were cautious ahead of the announcement of a new governor for the Reserve Bank of India (RBI) expected to happen in coming days. Additionally, downside in the domestic market sentiments led to negative movement in the currency. However, constant inflow of foreign funds in debt and equity markets cushioned sharp downside in the currency. Indian Rupee moved in the range of 66.9075 to 67.0650 in Friday’s trading session. The currency has depreciated around 29 paise or 0.43 percent in last two trading days. The Reserve Bank of India (RBI) fixed reference rate for the dollar was seen at 66.9296 and Euro stood at 75.8714 in Friday’s trade. In cross-currency trades, the rupee dropped further against the pound sterling to 87.97 from 87.86 on Thursday and also moved down further against the euro to 75.91 from 75.72. The domestic currency also fell against the Japanese yen to 66.92 per 100 yens from 66.63. US Dollar Index gained around 0.36 percent in Friday’s trading session due to rise in risk aversion in global market sentiments which led to increase in demand for the low yielding currency. However, estimates of favourable economic data from the country capped sharp upside movement in the currency. Euro against dollar declined around 0.25 percent on Friday on account of strength in the dollar index. Further, weak global market sentiments led to negative movement in the currency. Additionally, weak economic data from the region continued with downside in the currency. German Producer Price Index (PPI) fell marginally to 0.2 percent in July as against a rise of 0.4 percent in June. The Sterling Pound plunged by 0.7 percent in Friday’s trade as a result of unfavourable economic data from the country. More- over, weak global market sentiments coupled with stronger dollar continued with downside movement in the currency. UK’s Public Sector Net Borrowing was at a deficit of 1.5 billion Pounds in July with respect to surplus of 7.5 billion Pounds a month ago. The Japanese Yen against dollar depreciated around 0.33 percent in Friday’s trading session due to rise in risk appetite in glob- al market sentiments in early part of the trade which led to decline in demand for the low yielding currency. However, favour- able economic data from the country cushioned sharp fall in the currency. Japan’s Industries Activity gained around 1 percent in June as against a decline of 1.3 percent a month ago. SEBI Certified – Research Analyst Equities I Commodities I Currencies I Mutual Funds Last PrevCl. PriceChng PriceChng% DollarIndex 94.48 94.14 0.34 0.36 USD/INR(Spot) 67.13 66.83 0.30 0.45 USD/INR(NseAug) 67.15 66.90 0.25 0.37 EUR/INR(Spot) 76.02 75.82 0.20 0.26 EUR/INR(NseAug 76.01 75.73 0.28 0.37 GBP/INR(Spot) 87.78 88.01 (0.23) (0.26) GBP/INR(NseAug) 88.13 88.01 0.12 0.14 JPY/INR(NseAug) 67.02 66.69 0.33 0.50 MarketHighlights
- 2. Technical View: The price has given breakout of its falling trend at 65.80 levels on daily chart. Price has shown breakout of horizontal trend line at 66.75 levels on daily chart. Moreover, prices have been trading above its 21 DEMA on daily chart, which indicates short term trend remains up. On daily chart, momentum oscillator RSI has moved above 60 levels, which gives positive confirmation to the prices. A momentum indicator MACD has shown positive crossover on daily hourly chart, which indicates further bullishness in the prices. For now we expect prices to move higher towards 67.40 lev- els in few trading sessions. Pivot levels for the Day Technical View: The price has given breakout of its falling wedge pattern at 67.10 levels on daily chart with bolstering volumes. On the other hand price have given breakout of horizontal trend line at 67.05 levels on daily chart. Moreover, price have been trading above its 21 daily expo- nential moving average which suggest short term trend is bullish. So any dip in the prices towards 67 level, used as buying opportunity. A momentum indicator RSI has moved above 45 levels on daily chart, which suggest bullishness in the prices. A momentum indictor MACD has given positive crossover on daily chart, which gives positive confirmation to the prices. For now we expect prices to move higher towards 67.45 lev- els in few trading sessions. Currency Highlights 22nd Aug’2016 USDINR JPYINR SEBI Certified – Research Analyst Equities I Commodities I Currencies I Mutual Funds S3 S2 S1 Pivot R1 R2 R3 USDINR 66.75 66.92 67.04 67.09 67.21 67.26 67.43 JPYINR 66.27 66.62 66.91 66.97 67.26 67.32 67.67
- 3. Pivot levels for the Day Currency Highlights 22nd Aug’2016 GBPINR EURINR Technical View: The prices have been trading in descending triangle pattern from past few weeks and prices has taken support of its low- er band of triangle pattern at 74 levels on daily chart. On the other hand, Pair has been trading above its 21 daily exponential moving average which indicates that trend is turned into bullish. A momentum oscillator RSI have been trading above 45 lev- els on daily chart which gives the signs of bullishness to the prices. Moreover, momentum indicator MACD has shown bullish sign on daily chart which support our bullish view on the pair. For now we expect prices should move higher towards 76.60 levels in the coming trading sessions. Technical View: The price has been trading in descending triangle formation from past weeks and prices have been facing resistance of its upper bad of triangle at 88.20 levels on daily chart. The prices have been trading below its 21 DEMA, which sug- gest short term trend is down. A momentum indicator RSI has remained below 50 levels on daily chart, which suggest bearishness in the prices. Moreover, momentum indicator MACD has shown negative sign on daily chart which support our bearish view on the pair. For now we expect prices should move lower towards 87.40 levels in the coming trading sessions. SEBI Certified – Research Analyst Equities I Commodities I Currencies I Mutual Funds S3 S2 S1 Pivot R1 R2 R3 GBPINR 87.66 87.88 88.01 88.10 88.23 88.32 88.54 EURINR 75.49 75.72 75.87 75.95 76.10 76.18 76.41
- 4. Currency Highlights SEBI Certified – Research Analyst Equities I Commodities I Currencies I Mutual Funds Economic Indicators Date Time Data Prior Expected Impact 22nd Aug’2016
- 5. Currency Highlights 22nd Aug’2016 SEBI Certified – Research Analyst Equities I Commodities I Currencies I Mutual Funds Amit Pathania Digitally signed by Amit Pathania DN: cn=Amit Pathania, o=Choice Equity Broking Pvt. ltd, ou=Research Department, email=amit.pathania@choiceindia.com, c=IN Date: 2016.08.22 09:01:27 +05'30'