From Luxury Escort Service Kamathipura : 9352852248 Make on-demand Arrangemen...
Currency high lights 11.08.16
1. Currency Highlights
11th
Aug’2016
HighLights:
Indian Rupee touched a 2 month high at 66.72 in Wednesday’s trade
Japanese banks closed today on the eve of Mountain Day holiday
US JOLTS Job Openings jumped to 5.62 million in the month of June
French Industrial Production plunged by 0.8 percent a month ago
Japan’s Tertiary Industry Activity rose by 0.8 percent in month of June
Indian Rupee continued to gain further and rose to two month high and
appreciated around 13 paise to end at 66.72 against the US dollar on
Wednesday. The currency appreciated on account of selling of dollars
from exporters and banks. Further, constant inflow of foreign funds in
debt and equity markets led to upside movement in the currency.
However, sharp upside in the currency was capped due to fall in domestic
market sentiments. Indian Rupee moved in the range of 66.6650 to
66.7825 in Wednesday’s trading session. The Reserve Bank of India (RBI)
fixed reference rate for the dollar was seen at 66.7442 and Euro stood at
74.3797 in Wednesday’s trade The domestic unit ended steady against
the euro at 74.05.
In cross-currency trades, the rupee fell against the pound sterling to 87.22 from 86.72 on Tuesday and also dropped against
the Japanese yen to end at 65.94 per 100 yens from 65.39. The domestic unit fell against the euro to 74.61 from 74.05.
US Dollar Index declined around 0.6 percent in Wednesday’s trading session due to unfavourable economic data from the
country. However, sharp downside in the currency was cushioned as a result of rise in risk aversion in global market senti-
ments which led to increase in demand for the low yielding currency.
US Job Openings and Labor Turnover Summary (JOLTS) Job Openings jumped to 5.62 million in June as against a rise of 5.51
million in May. Federal Budget Balance was at a deficit of $112.8 billion in July with respect to surplus of $6.3 billion in June.
Euro against dollar gained around 0.52 percent on Wednesday on account of weakness in the dollar index. However, weak
global market sentiments coupled with unfavourable economic data from the region capped sharp rise in the currency.
French Industrial Production plunged by 0.8 percent in June with respect to fall of 0.5 percent in May.
The Sterling Pound rose marginally in Wednesday’s trade as a result of weaker dollar. Further, upbeat global market senti-
ments continued with positive movement in the currency.
The Japanese Yen against dollar appreciated around 0.6 percent in Wednesday’s trading session due to rise in risk aversion in
global market sentiments in later part of the trade which led to increase in demand for the low yielding currency.
Japan’s Tertiary Industry Activity rose by 0.8 percent in June as against a decline of 1.2 percent a month ago.
SEBI Certified – Research Analyst Equities I Commodities I Currencies I Mutual Funds
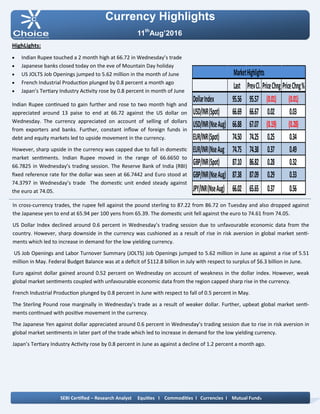
Last PrevCl. PriceChng PriceChng%
DollarIndex 95.56 95.57 (0.01) (0.01)
USD/INR(Spot) 66.69 66.67 0.02 0.03
USD/INR(NseAug) 66.88 67.07 (0.19) (0.28)
EUR/INR(Spot) 74.50 74.25 0.25 0.34
EUR/INR(NseAug 74.75 74.38 0.37 0.49
GBP/INR(Spot) 87.10 86.82 0.28 0.32
GBP/INR(NseAug) 87.38 87.09 0.29 0.33
JPY/INR(NseAug) 66.02 65.65 0.37 0.56
MarketHighlights
2. Technical View:
The price has taken support of its rising trend line at 64.50
levels on daily chart. The pair has been trading in rising chan-
nel pattern and price has taken support of its lower band of
channel pattern at 63.40 levels on daily chart. Price has
formed bullish inverted hammer candle stick pattern with ap-
pealing volumes which is bullish reversal pattern. However,
prices have been facing resistance of 66.40 levels on daily
chart. Any major movement can been seen after breakout of
falling trend line at 66.50 levels.
In addition, on daily chart prices have been trading above its
21 daily exponential moving average which gives the bullish
confirmation to the prices.
On daily chart, momentum oscillator RSI has moved above
60 levels, which gives positive confirmation to the prices.
A momentum indicator MACD has shown positive crossover
on daily chart, which indicates further bullishness in the pric-
es.
Pivot levels for the Day
Technical View:
The price has given breakdown of rising channel pattern at
67.10 levels on daily chart. On the other hand prices have
been facing resistance of its horizontal trend line at 67.20
levels on daily chart.
Moreover, price have been trading below its 21 daily expo-
nential moving average which suggest short term trend is
bearish. So any rally in the prices towards 67 level, used as
selling opportunity.
A momentum indicator RSI has moved below 45 levels on
daily chart, which suggest bearishness in the prices.
A momentum indictor MACD has given negative crossover
on daily chart, which gives negative confirmation to the pric-
es.
For now we expect prices to move lower towards 66.55 lev-
els in few trading sessions.
Currency Highlights
11th
Aug’2016
USDINR JPYINR
SEBI Certified – Research Analyst Equities I Commodities I Currencies I Mutual Funds
S3 S2 S1 Pivot R1 R2 R3
USDINR 67.98 67.31 67.09 66.64 66.42 65.97 65.30
JPYINR 65.52 65.78 65.91 66.04 66.17 66.30 66.56
3. Pivot levels for the Day
Currency Highlights
11th
Aug’2016
GBPINR EURINR
Technical View:
The prices have been trading in descending triangle pattern
from past few weeks and prices has faced resistance of its
upper band of triangle pattern at 77 levels on daily chart.
On the other hand, Pair has been trading below its 21 daily
exponential moving average which indicates that trend is
remains down.
A momentum oscillator RSI have been trading below 50 lev-
els on daily chart which gives the signs of bullishness to the
prices.
Moreover, momentum indicator MACD has shown negative
sign on daily chart which support our bearish view on the
pair.
For now we expect prices should move lower towards 73.90
levels in the coming trading sessions.
Technical View:
The price has given breakdown of its symmetrical triangle
pattern at 88.50 levels on daily chart. Price has also given
the breakdown of its consolidation range of 89.50 to
88.50levels on hourly chart.
The price has formed Bearish candle on daily with appalling
volumes which indicates further down side movement can
be seen.
A momentum indicator RSI has moved below at 45 levels
on hourly chart, which suggest bearishness in the prices.
Moreover, momentum indicator MACD has shown negative
crossover on 4 hourly chart which support our bearish view
on the pair.
For now we expect prices should move lower towards 86.60
levels in the coming trading sessions.
SEBI Certified – Research Analyst Equities I Commodities I Currencies I Mutual Funds
S3 S2 S1 Pivot R1 R2 R3
GBPINR 86.78 87.08 87.25 87.38 87.55 87.68 87.98
EURINR 74.11 74.42 74.58 74.73 74.89 75.04 75.35
4. Currency Highlights
SEBI Certified – Research Analyst Equities I Commodities I Currencies I Mutual Funds
Economic Indicators
Date Time Data Prior Expected Impact
11.08.16 12:15PM French Final CPI m/m -0.4% -0.4% Actual > Forecast = Good for
currency; EURINR
11.08.16 1:30PM Italian Trade Balance 5.03B Actual > Forecast = Good for
currency; EURINR
11.08.16 6:00PM Unemployment Claims 269K 272K Actual < Forecast = Good for
currency; USDINR
11.08.16 6:00PM Import Prices m/m -0.2% 0.2% Actual > Forecast = Good for
currency; USDINR
11.08.16 8:00PM Natural Gas Storage -6B
11.08.16 10:31 PM 30-y Bond Auction 2.17
11th
Aug’2016
5. Currency Highlights
11th
Aug’2016
SEBI Certified – Research Analyst Equities I Commodities I Currencies I Mutual Funds
Amit Pathania
Digitally signed by Amit Pathania
DN: cn=Amit Pathania, o=Choice Equity Broking Pvt. ltd, ou=Research
Department, email=amit.pathania@choiceindia.com, c=IN
Date: 2016.08.11 08:42:11 +05'30'