1. Currency Highlights
16th
Jan’2017
HighLights:
Indian Rupee traded on a flat note at 68.18 in Friday’s trade
US Core Retail Sales dropped by 0.2 percent in Dec
German Wholesale Price Index grew by 1.2 percent in Dec
US Retail Sales expanded by 0.6 percent in month of Dec’16
US Prelim UoM Consumer Sentiment fell to 98.1-mark in Jan
Indian Rupee remained unchanged and ended on flat note to 68.18
against the US dollar on Friday. The currency depreciated on account of
dollar demand from importers and banks. Further, weak domestic mar-
ket sentiments led to negative movement in the currency.
Moreover, outflow of foreign funds from selling in equities by the institu-
tional investors kept pressure on the currency. So far this year, foreign
institutional investors sold $459.20 million in equity and $22.2 million in
debt. Investors were cautious ahead of the WPI data to be released on
Monday. Indian Rupee moved in the range of 68.154 to 68.225 in Fri-
day’s trade. The Reserve Bank of India (RBI) fixed reference rate for the
dollar was seen at 68.2310 and Euro stood at 72.4750 as on 13th Jan’17.
For the month of January2017, FII outflows in equities totalled at Rs.3808.71 crores ($559.32 million) as on 13thJanuary 2017.
Year to date basis, net capital outflows stood at Rs.3808.71 crores ($559.32 million) as on 13thJanuary 2017.
US Dollar Index dropped around 0.2 percent in Friday’s trading session due to unfavourable economic data from the country.
Further, rise in risk appetite in global market sentiments in later part of the trade which led to decline in demand for the low
yielding currency.
US Core Retail Sales dropped marginally by 0.2 percent in December as against a rise of 0.3 percent in November. Producer
Price Index (PPI) grew at slow pace of 0.3 percent in previous month from 0.4 percent in November. Retail Sales expanded by
0.6 percent in December with respect to 0.2 percent a month ago. Core PPI was at 0.2 percent in prior month when compared
to 0.4 percent in November. Prelim UoM Consumer Sentiment declined marginally to 98.1-mark in January from 98.2-level in
December.
Euro against dollar jumped around 0.3 percent on Friday on account of weakness in the dollar index along with favourable
economic data from the region. Further, upbeat global market sentiments kept the currency in positive territory.
German Wholesale Price Index (WPI) grew by 1.2 percent in December as against a rise of 0.1 percent in November.
The Sterling Pound rose around 0.13 percent in Friday’s trade as a result of upbeat global market sentiments. Moreover, weak-
er dollar continued with positive movement in the currency.
The Japanese Yen against dollar appreciated around 0.2 percent in Friday’s trading session due to rise in risk aversion in global
market sentiments in early part of the trade which led to increase in demand for the low yielding currency.
SEBI Certified – Research Analyst Equities I Commodities I Currencies I Mutual Funds
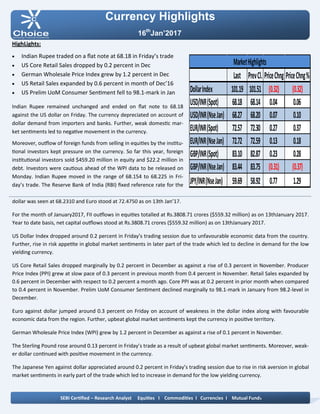
Last PrevCl. PriceChng PriceChng%
DollarIndex 101.19 101.51 (0.32) (0.32)
USD/INR(Spot) 68.18 68.14 0.04 0.06
USD/INR(NseJan) 68.27 68.20 0.07 0.10
EUR/INR(Spot) 72.57 72.30 0.27 0.37
EUR/INR(NseJan) 72.72 72.59 0.13 0.18
GBP/INR(Spot) 83.10 82.87 0.23 0.28
GBP/INR(NseJan) 83.44 83.75 (0.31) (0.37)
JPY/INR(NseJan) 59.69 58.92 0.77 1.29
MarketHighlights
2. Technical View:
On daily chart, it has been observed that the JPYINR has
completed a Bullish Bat harmonic pattern at 57.55 levels
the coordinates of which are as follows:
The pair has given breakout of its horizontal pattern at
59.20 levels on daily chart.
Moreover, prices have been trading below its 50 DSMA
which gives the sign of bullishness in the prices.
On daily chart momentum indicator RSI is trading above
50 levels which indicates up side momentum can be
seen in the prices.
In addition, momentum indicator MACD has shown posi-
tive crossover which suggest possibilities of rebound in
the prices on daily chart.
So for trading perspective, one could JPYINR buy in the
range of 59.50 with SL of 59.20 for target of 60.10 levels.
Pivot levels for the Day
Technical View:
The pair has been moving in its rising channel pattern
and prices have been facing resistance of its upper band
of channel pattern at 68.60 levels on hourly chart.
The price has faced resistance of its horizontal trend line
at 68.40 levels on hourly chart.
Moreover, prices have been trading below its 21 HSMA
which gives the sign of bullishness in the prices.
A momentum indicator RSI has shown bearish range
shift at 58 levels, which suggest further negative mo-
mentum can be seen in the prices.
In addition, momentum indicator MACD has shown
negative crossover on hourly chart.
So for trading perspective, one could sell USDINR in
range 68.40 with SL of 68.60 for target of 68.
Currency Highlights
16th
Jan’2017
USDINR JPYINR
SEBI Certified – Research Analyst Equities I Commodities I Currencies I Mutual Funds
S3 S2 S1 Pivot R1 R2 R3
USDINR 68.03 68.16 68.22 68.29 68.35 68.42 68.55
JPYINR 57.70 58.72 59.18 59.74 60.20 60.76 61.78
3. Pivot levels for the Day
Currency Highlights
16th
Jan’2017
GBPINR EURINR
Technical View:
The price has taken support of its horizontal trend line
at 71.80 levels on daily chart. The EURINR pair has also
taken support of its falling trend line at 70.70 levels on
daily chart.
The pair has been trading above its 21 DSMA on daily
chart, which suggest further bullishness can be seen in
the prices.
On daily chart momentum oscillator RSI has been mov-
ing above 50 levels on daily chart, which suggest bullish-
ness in the prices.
A momentum indicator MACD has shown positive cross-
over on daily chart, which support our bullish view to
the prices.
For now we can expect prices should move higher to-
wards 73.30 levels in the coming trading session.
Technical View:
The prices has been facing resistance of its falling trend
line at 84.20 levels on hourly chart.
The price have shown breakdown of its rising channel
pattern at 83.60 levels on hourly chart and price has
rested its channel breakdown trend line at 83.50 levels.
Moreover, prices have been trading below 21 HSMA,
which suggest short term trend looks weak.
Moreover, momentum indicator MACD has given nega-
tive cross over on hourly chart, which gives the sign of
bearishness in the prices.
The momentum indictor RSI has been trading below 60
levels on hourly chart, which suggest the possibilities of
further downside momentum in the prices.
For now we expect prices should move lower towards
82.60 levels coming trading sessions.
SEBI Certified – Research Analyst Equities I Commodities I Currencies I Mutual Funds
S3 S2 S1 Pivot R1 R2 R3
GBPINR 82.19 82.77 83.11 83.35 83.69 83.93 84.51
EURINR 71.87 72.26 72.49 72.65 72.88 73.04 73.43
4. Currency Highlights
SEBI Certified – Research Analyst Equities I Commodities I Currencies I Mutual Funds
16th
Jan’2017
Economic Indicators
Date Time Data Prior Expected Impact
16.01.17 05:20 PM PPI y/y 0.4% 0.1% Actual > Forecast = Good for
currency; JPYINR
16.01.17 03:30 PM Trade Balance 01.% 0.5% Actual > Forecast = Good for
currency; EURINR
5. Currency Highlights
16th
Jan’2017
SEBI Certified – Research Analyst Equities I Commodities I Currencies I Mutual Funds
Anish Vyas
Digitally signed by Anish Vyas
DN: cn=Anish Vyas, o=Choice Merchandise
Broking Pvt. Ltd, ou=Sr. Research Associate,
email=anish.vyas@choiceindia.com, c=IN
Date: 2017.01.16 08:47:56 +05'30'