The Indian rupee plunged 24 paise against the US dollar to 67.41 due to the surprise decision of RBI Governor Raghuram Rajan to not seek a second term. German producer price index rose 0.4% in May while the UK Rightmove house price index increased 0.8% in June. Japan posted a trade surplus of 0.27 trillion yen in May. Technical analysis indicates the USDINR and JPYINR may rise while GBPINR and EURINR are expected to appreciate on supportive indicators. Key economic data releases include the German ZEW survey and comments from ECB President Draghi and Fed Chair Yellen.
1. Currency Highlights
21st
June’2016
HighLights:
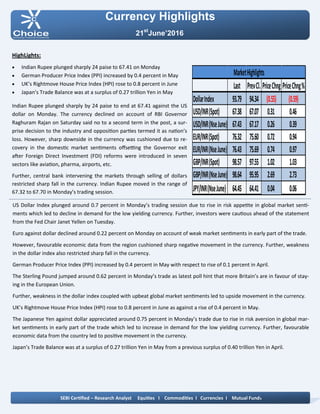
Indian Rupee plunged sharply 24 paise to 67.41 on Monday
German Producer Price Index (PPI) increased by 0.4 percent in May
UK’s Rightmove House Price Index (HPI) rose to 0.8 percent in June
Japan’s Trade Balance was at a surplus of 0.27 trillion Yen in May
Indian Rupee plunged sharply by 24 paise to end at 67.41 against the US
dollar on Monday. The currency declined on account of RBI Governor
Raghuram Rajan on Saturday said no to a second term in the post, a sur-
prise decision to the industry and opposition parties termed it as nation’s
loss. However, sharp downside in the currency was cushioned due to re-
covery in the domestic market sentiments offsetting the Governor exit
after Foreign Direct Investment (FDI) reforms were introduced in seven
sectors like aviation, pharma, airports, etc.
Further, central bank intervening the markets through selling of dollars
restricted sharp fall in the currency. Indian Rupee moved in the range of
67.32 to 67.70 in Monday’s trading session.
US Dollar Index plunged around 0.7 percent in Monday’s trading session due to rise in risk appetite in global market senti-
ments which led to decline in demand for the low yielding currency. Further, investors were cautious ahead of the statement
from the Fed Chair Janet Yellen on Tuesday.
Euro against dollar declined around 0.22 percent on Monday on account of weak market sentiments in early part of the trade.
However, favourable economic data from the region cushioned sharp negative movement in the currency. Further, weakness
in the dollar index also restricted sharp fall in the currency.
German Producer Price Index (PPI) increased by 0.4 percent in May with respect to rise of 0.1 percent in April.
The Sterling Pound jumped around 0.62 percent in Monday’s trade as latest poll hint that more Britain’s are in favour of stay-
ing in the European Union.
Further, weakness in the dollar index coupled with upbeat global market sentiments led to upside movement in the currency.
UK’s Rightmove House Price Index (HPI) rose to 0.8 percent in June as against a rise of 0.4 percent in May.
The Japanese Yen against dollar appreciated around 0.75 percent in Monday’s trade due to rise in risk aversion in global mar-
ket sentiments in early part of the trade which led to increase in demand for the low yielding currency. Further, favourable
economic data from the country led to positive movement in the currency.
Japan’s Trade Balance was at a surplus of 0.27 trillion Yen in May from a previous surplus of 0.40 trillion Yen in April.
SEBI Certified – Research Analyst Equities I Commodities I Currencies I Mutual Funds
Last PrevCl. PriceChng PriceChng%
DollarIndex 93.79 94.34 (0.55) (0.59)
USD/INR(Spot) 67.38 67.07 0.31 0.46
USD/INR(NseJune) 67.43 67.17 0.26 0.39
EUR/INR(Spot) 76.32 75.60 0.72 0.94
EUR/INR(NseJune) 76.43 75.69 0.74 0.97
GBP/INR(Spot) 98.57 97.55 1.02 1.03
GBP/INR(NseJune) 98.64 95.95 2.69 2.73
JPY/INR(NseJune) 64.45 64.41 0.04 0.06
MarketHighlights
2. Technical View:
The pair has given breakout of its horizontal trend line at 64
levels on daily chart. The JPYINR price has been trading in rec-
tangle pattern form past few weeks and price has shown
breakout of its resistance which is upper band of channel
pattern at 63.30 levels on daily chart. On daily chart, price has
shown breakout of rising wedge pattern at 64 levels.
In addition, on daily chart prices have been trading above its
21 day exponential moving average which gives the positive
confirmation to the prices.
On daily chart, momentum oscillator RSI has moved above 60
levels, which gives positive confirmation to the prices.
A momentum indicator MACD has shown positive crossover
on daily chart, which indicates short term trend remains bull-
ish.
For now we expect prices to move higher towards 65 levels in
few trading sessions.
Pivot levels for the Day
Technical View:
The price has been trading in its rising channel formation
from past few months and price has taken support of its of its
lower band of channel pattern at 67 levels on daily chart.
Price has formed piercing candle stick pattern on daily chart,
which is bullish pattern.
Moreover, price have been trading above of its 21 daily expo-
nential moving average which suggest near term remains up.
So any dips in the prices towards 67.45 level, used as buying
opportunity.
A momentum indicator RSI has moved above 45 levels on
daily chart, which suggest bullishness in the prices.
A momentum indictor MACD has given positive crossover on
daily chart, which gives positive confirmation to the prices.
For now we expect prices to move higher towards 67.90 lev-
els in few trading sessions.
Currency Highlights
21st
June’2016
USDINR JPYINR
SEBI Certified – Research Analyst Equities I Commodities I Currencies I Mutual Funds
S3 S2 S1 Pivot R1 R2 R3
USDINR 67.48 67.56 67.51 67.64 67.59 67.72 67.80
JPYINR 63.55 64.03 64.22 64.51 64.70 64.99 65.47
3. Pivot levels for the Day
Currency Highlights
21st
June’2016
GBPINR EURINR
Technical View:
The pair has given breakout of its symmetrical triangle
pattern at 76.45 levels on daily chart with bolstering vol-
umes.
On the other hand, Pair has been trading above its 21 daily
exponential moving average which indicates that trend is
remains up.
A momentum oscillator RSI have been trading above 60 lev-
els on daily chart which gives the signs of bullishness to the
prices.
Moreover, momentum indicator MACD has shown positive
crossover on daily chart which support our bullish view on
the pair.
For now we expect prices should move higher towards 77.10
levels in the coming trading sessions.
Technical View:
The prices have been moving in rectangle formation form
past few months and prices have been facing resistance of its
upper band of pattern at 99 levels. Any major movement
can be seem if prices are closing above 99 levels .
On the other hand, Pair has been trading above its 21 daily
exponential moving average which indicates that short term
trend is remains bullish.
A momentum indicator RSI has moved above 62 levels on
daily chart, which suggest bullishness in the prices.
Moreover, momentum indicator MACD has shown positive
crossover on daily chart which support our bullish view on
the pair.
For now we expect prices should move higher towards 100
levels in the coming trading sessions.
SEBI Certified – Research Analyst Equities I Commodities I Currencies I Mutual Funds
S3 S2 S1 Pivot R1 R2 R3
GBPINR 97.07 97.84 98.24 98.61 99.01 99.38 100.15
EURINR 74.00 75.23 75.83 76.46 77.06 77.69 78.92
4. Currency Highlights
SEBI Certified – Research Analyst Equities I Commodities I Currencies I Mutual Funds
Economic Indicators
Date Time Data Prior Expected Impact
21.06.16 Tentative German Constitutional Court
Ruling
21.06.16 2:00pm Public Sector Net Borrowing 6.6B 9.5B Actual < Forecast = Good for
currency; GBPINR
21.06.16 2:30pm German ZEW Economic Senti-
ment
6.4 5.1 Actual > Forecast = Good for
currency; EURINR
21.06.16 2:30pm ZEW Economic Sentiment 16.8 15.3 Actual > Forecast = Good for
currency; EURINR
21.06.16 6:30pm ECB President Draghi Speaks
21.06.16 7:30pm Fed Chair Yellen Testifies
21st
June’2016
5. Currency Highlights
21st
June’2016
SEBI Certified – Research Analyst Equities I Commodities I Currencies I Mutual Funds
Amit Pathania
Digitally signed by Amit Pathania
DN: cn=Amit Pathania, o=Choice Equity Broking Pvt. ltd, ou=Research
Department, email=amit.pathania@choiceindia.com, c=IN
Date: 2016.06.21 09:07:57 +05'30'