
Recommended
More Related Content
What's hot
What's hot (20)
Viewers also liked
Viewers also liked (19)
Similar to Currency high lights 29.11.16
Similar to Currency high lights 29.11.16 (19)
Recently uploaded
Recently uploaded (20)
Currency high lights 29.11.16
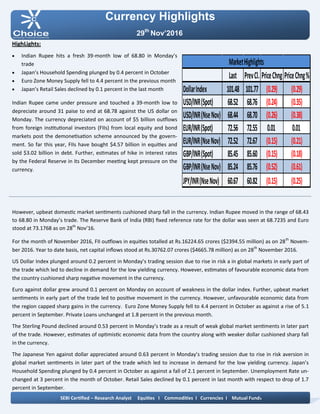
- 1. Currency Highlights 29th Nov’2016 HighLights: Indian Rupee hits a fresh 39-month low of 68.80 in Monday’s trade Japan’s Household Spending plunged by 0.4 percent in October Euro Zone Money Supply fell to 4.4 percent in the previous month Japan’s Retail Sales declined by 0.1 percent in the last month Indian Rupee came under pressure and touched a 39-month low to depreciate around 31 paise to end at 68.78 against the US dollar on Monday. The currency depreciated on account of $5 billion outflows from foreign institutional investors (FIIs) from local equity and bond markets post the demonetisation scheme announced by the govern- ment. So far this year, FIIs have bought $4.57 billion in equities and sold $3.02 billion in debt. Further, estimates of hike in interest rates by the Federal Reserve in its December meeting kept pressure on the currency. However, upbeat domestic market sentiments cushioned sharp fall in the currency. Indian Rupee moved in the range of 68.43 to 68.80 in Monday’s trade. The Reserve Bank of India (RBI) fixed reference rate for the dollar was seen at 68.7235 and Euro stood at 73.1768 as on 28th Nov’16. For the month of November 2016, FII outflows in equities totalled at Rs.16224.65 crores ($2394.55 million) as on 28th Novem- ber 2016. Year to date basis, net capital inflows stood at Rs.30762.07 crores ($4665.78 million) as on 28th November 2016. US Dollar Index plunged around 0.2 percent in Monday’s trading session due to rise in risk a in global markets in early part of the trade which led to decline in demand for the low yielding currency. However, estimates of favourable economic data from the country cushioned sharp negative movement in the currency. Euro against dollar grew around 0.1 percent on Monday on account of weakness in the dollar index. Further, upbeat market sentiments in early part of the trade led to positive movement in the currency. However, unfavourable economic data from the region capped sharp gains in the currency. Euro Zone Money Supply fell to 4.4 percent in October as against a rise of 5.1 percent in September. Private Loans unchanged at 1.8 percent in the previous month. The Sterling Pound declined around 0.53 percent in Monday’s trade as a result of weak global market sentiments in later part of the trade. However, estimates of optimistic economic data from the country along with weaker dollar cushioned sharp fall in the currency. The Japanese Yen against dollar appreciated around 0.63 percent in Monday’s trading session due to rise in risk aversion in global market sentiments in later part of the trade which led to increase in demand for the low yielding currency. Japan’s Household Spending plunged by 0.4 percent in October as against a fall of 2.1 percent in September. Unemployment Rate un- changed at 3 percent in the month of October. Retail Sales declined by 0.1 percent in last month with respect to drop of 1.7 percent in September. SEBI Certified – Research Analyst Equities I Commodities I Currencies I Mutual Funds Last PrevCl. PriceChng PriceChng% DollarIndex 101.48 101.77 (0.29) (0.29) USD/INR(Spot) 68.52 68.76 (0.24) (0.35) USD/INR(NseNov) 68.44 68.70 (0.26) (0.38) EUR/INR(Spot) 72.56 72.55 0.01 0.01 EUR/INR(NseNov) 72.52 72.67 (0.15) (0.21) GBP/INR(Spot) 85.45 85.60 (0.15) (0.18) GBP/INR(NseNov) 85.24 85.76 (0.52) (0.61) JPY/INR(NseNov) 60.67 60.82 (0.15) (0.25) MarketHighlights
- 2. Technical View: The price has given breakdown of its descending triangle pattern at 61 levels on daily chart. On daily chart JPYINR price has shown breakdown of its rising trend lie at 62.90 levels on daily chart. Moreover, prices have been trading below its 50 DEMA which gives the sign of bearishness in the prices. On daily chart momentum indicator RSI is trading below 50 levels which suggest further weakness can be seen in the prices. In addition, momentum indicator MACD has shown neg- ative crossover and trading below signal line on daily chart. So for trading perspective, one could JPYINR sell in the range of 61.20 with SL of 60.90 for target of 61.80 levels. Pivot levels for the Day Technical View: The pair has given breakout of its horizontal channel pattern at 68.32 levels on daily chart. On daily chart USDINR price is retested its breakout trend line at 68.40 levels. Moreover, prices have been trading above its 50 DEMA which gives the sign of bullishness in the prices. Furthermore, price has shown breakout of its horizontal trend line at 67.95 levels on daily chart. A momentum indicator RSI has traded above 60 levels, which suggest further positive momentum can be seen in the prices. In addition, momentum indicator MACD has shown pos- itive crossover on daily chart. So for trading perspective, one could buy USDINR in range 68.60 with SL of 68.20 for target of 69.30. Currency Highlights 29th Nov’2016 USDINR JPYINR SEBI Certified – Research Analyst Equities I Commodities I Currencies I Mutual Funds S3 S2 S1 Pivot R1 R2 R3 USDINR 67.66 68.07 68.25 68.48 68.66 68.89 69.30 JPYINR 59.13 59.83 60.25 60.53 60.95 61.23 61.93
- 3. Pivot levels for the Day Currency Highlights 29th Nov’2016 GBPINR EURINR Technical View: The price has shown breakdown of its descending trian- gle a pattern at 72.70 levels on daily chart. The EURINR pair has shown horizontal trend line at 72.80 levels on daily chart. The pair has been trading below its 50 DEMA on daily chart, which suggest further weakness can be seen in the prices. On daily chart momentum oscillator RSI have been trad- ing below 60 which suggest bearishness in the prices. A momentum indicator MACD has shown negative crossover on daily chart, which add more bearishness in the prices. For now we can expect prices should move lower to- wards 72.40 levels in the coming trading session. Technical View: The pair has shown breakout of its rising channel pattern at 85 levels on daily chart. Moreover, prices have been trading above 21 DEMA, which suggest short term trend looks positive. Moreover, price has shown breakout of its horizontal trend line at 84.60 levels on daily chart. A momentum indicator MADC has given positive Cross over on hourly chart, which gives the sign of bullishness in the prices. The momentum indictor RSI has been trading above 60 levels on daily chart, which suggest the possibilities of bounce back in the in the prices. For now we expect prices should move higher towards 86.30 levels coming trading sessions. SEBI Certified – Research Analyst Equities I Commodities I Currencies I Mutual Funds S3 S2 S1 Pivot R1 R2 R3 GBPINR 84.05 84.65 84.95 85.25 85.55 85.85 86.45 EURINR 71.64 72.05 72.29 72.46 72.70 72.87 73.28
- 4. Currency Highlights SEBI Certified – Research Analyst Equities I Commodities I Currencies I Mutual Funds 29th Nov’2016 Economic Indicators Date Time Data Prior Expected Impact 29.11.16 01:15 PM French Consumer Spending m/m -0.2% 0.2% Actual > Forecast = Good for currency; EURINR 29.11.16 01:30 PM Spanish Flash CPI y/y 0.7% 0.5% Actual > Forecast = Good for currency; EURINR 29.11.16 07:00 PM Prelim GDP q/q 2.9% 3.0% More hawkish than expected = Good for currency; USDINR 29.11.16 8:30 PM CB Consumer Confidence 98.6 101.30 Actual < Forecast = Good for currency; USDINR 29.11.16 11:10 PM FOMC Member Powell Speaks More hawkish than expected = Good for currency; USDINR
- 5. Currency Highlights 29th Nov’2016 SEBI Certified – Research Analyst Equities I Commodities I Currencies I Mutual Funds Amit Pathania Digitally signed by Amit Pathania DN: cn=Amit Pathania, o=Choice Equity Broking Pvt. ltd, ou=Research Department, email=amit.pathania@choiceindia.com, c=IN Date: 2016.11.29 08:59:54 +05'30'