1. Currency Highlights
14th
Oct’2016
HighLights:
India’s CPI plunged to 4.31 percent in the month of September
US Unemployment Claims at 246,000 for w/e on 7th Oct’16
German Final CPI unchanged at 0.1 percent in the last month
China’s Consumer Price Index (CPI) grew 1.9 percent in Sep’16
China’s Consumer Price Index (CPI) grew by 1.9 percent in Septem-
ber as against a rise of 1.3 percent in August. Producer Price Index
(PPI) also increased by 0.1 percent in September from a decline of
0.8 percent a month ago.
Indian Rupee came under pressure and depreciated by 40 paise to
end at 66.94 against the US dollar on Thursday. The currency de-
preciated on account of increased dollar demand from banks and
importers. Further, plunge in the country’s industrial production
data led to negative movement in the currency.
Moreover, weak domestic market sentiments kept the currency in negative territory. Indian Rupee moved in the range of
66.76 to 66.9550 in Thursday’s trading session. The Reserve Bank of India (RBI) fixed reference rate for the dollar was seen at
66.84 and Euro stood at 73.66 as on 13th October, 2016.
India’s Consumer Price Index (CPI) plunged to 4.31 percent in September as against a rise of 5.05 percent in August.
US Dollar Index declined by 0.45 percent in Thursday’s trading session due to unfavourable economic data from the country.
However, sharp fall in the currency was cushioned due to rise in risk aversion in global markets which led to increase in de-
mand for the low yielding currency.
US Unemployment Claims remained unchanged at 246,000 for the week ending on 7th Oct’16. Import Prices grew by 0.1 per-
cent in September with respect to decline of 0.2 percent in August.
Euro against dollar rose around 0.45 percent on Thursday on account of weakness in the dollar index. However, sharp upside
in the currency was capped as a result of unfavourable economic data from the region along with weak global market se-
nitments.
German Final Consumer Price Index (CPI) remained unchanged at 0.1 percent in September.
The Sterling Pound gained around by around 0.38 percent in Thursday’s trade as a result of estimates of favourable economic
data from the country. Further, weaker dollar continued with positive movement in the currency. However, sharp rise in the
currency was prevented due to weak global market senitments.
The Japanese Yen against dollar appreciated around 0.5 percent in Thursday’s trading session due to rise in risk aversion in
global market sentiments which led to increase in demand for the low yielding currency.
SEBI Certified – Research Analyst Equities I Commodities I Currencies I Mutual Funds
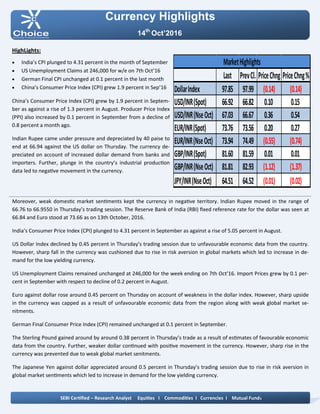
Last PrevCl. PriceChng PriceChng%
DollarIndex 97.85 97.99 (0.14) (0.14)
USD/INR(Spot) 66.92 66.82 0.10 0.15
USD/INR(NseOct) 67.03 66.67 0.36 0.54
EUR/INR(Spot) 73.76 73.56 0.20 0.27
EUR/INR(NseOct) 73.94 74.49 (0.55) (0.74)
GBP/INR(Spot) 81.60 81.59 0.01 0.01
GBP/INR(NseOct) 81.81 82.93 (1.12) (1.37)
JPY/INR(NseOct) 64.51 64.52 (0.01) (0.02)
MarketHighlights
2. Technical View:
On daily chart JPYINR prices have been trading in sym-
metrical triangle pattern and shown breakdown of its
symmetrical triangle pattern. However, price has formed
bearish candle stick on daily chart.
Moreover, breakdown can be seen in the prices with bol-
stering volumes. On the other hand price has shown
breakdown of its rising trend line at 65.60 levels on daily
chart.
Furthermore, prices have been trading below its 21 DE-
MA, which suggest short term trend is negative.
On daily chart momentum indicator RSI is trading below
at 45 levels which suggest further weakness in the pric-
es.
So for trading perspective, one could use sell in the
range of 64.70 with SL of 65 for Target of 64 levels.
Pivot levels for the Day
Technical View:
On daily USDINR prices have been trading in falling
channel formation from past few weeks and prices have
been facing resistance at upper band of channel pattern
at 67.05 levels. The pair has formed bearish candle stick
with appealing volumes.
On the other hand, prices have been facing resistance of
horizontal trend line at 66.95 levels on daily chart.
Moreover, prices have been trading below 21 DEMA
which gives the sign of bearishness in the prices.
A momentum indictor RSI has traded below 60 levels,
which suggest further weakness in the prices.
So for trading perspective, one could sell in range 67.05
with SL of 67.35 for target of 66.45.
Currency Highlights
14th
Oct’2016
USDINR JPYINR
SEBI Certified – Research Analyst Equities I Commodities I Currencies I Mutual Funds
S3 S2 S1 Pivot R1 R2 R3
USDINR 66.57 66.78 66.91 66.99 67.12 67.20 67.41
JPYINR 63.88 64.18 64.35 64.48 64.65 64.78 65.08
3. Pivot levels for the Day
Currency Highlights
14th
Oct’2016
GBPINR EURINR
Technical View:
The EURINR pair has been trading in descending triangle
pattern and price has shown breakdown of its symmet-
rical triangle pattern at 74.80 levels on daily chart.
Moreover, prices have been trading below its 21 DE-
MA, which suggest short term trend is down. The pair
has shown breakdown of its horizontal trend line at
74.70 levels on daily chart.
On daily chart momentum oscillator RSI have been trad-
ing below 60 which suggest bearishness in the prices.
A momentum indicator MACD has shown negative
crossover on daily chart, which add more bearishness in
the prices.
For now we can expect prices should move lower to-
wards 73.20 levels in the coming trading session.
Technical View:
On daily GBPINR price has been trading in falling chan-
nel pattern and price has shown breakdown of its falling
channel pattern at 83.50 levels on daily chart.
Moreover, prices have been trading below 21 DEMA,
which suggest short term trend remains weak.
The price has given breakdown of horizontal trend line
at 85.20 levels on daily chart.
A momentum indicator MADC has given negative Cross
over on daily chart, which gives the sign of bearishness
in the prices.
The momentum indictor RSI has been trading below 40
levels on daily chart. Which suggest lack of strength in
the prices.
For now we expect prices should move lower towards
81.20 levels coming trading sessions.
SEBI Certified – Research Analyst Equities I Commodities I Currencies I Mutual Funds
S3 S2 S1 Pivot R1 R2 R3
GBPINR 80.71 81.21 81.52 81.71 82.02 82.21 82.71
EURINR 73.07 73.51 73.72 73.95 74.16 74.39 74.83
4. Currency Highlights
SEBI Certified – Research Analyst Equities I Commodities I Currencies I Mutual Funds
14th
Oct’2016
Economic Indicators
Date Time Data Prior Expected Impact
14.10.16 7:00 AM CPI y/y 1.3% 1.6% Actual > Forecast = Good
for currency; CNY
14.10.16 7:00 AM PPI y/y -0.8% -0.4% Actual >Forecast = Good for
currency; CNY
14.10.16 14th-18th Foreign Direct Investment
ytd/y
4.5% Actual >Forecast = Good for
currency; CNY
14.10.16 14th-16th M2 Money Supply y/y 11.4% 11.6% Actual< Forecast = Good for
currency; USDINR
14.10.16 14th-16th New Loans 949B 1000B More hawkish than expected
= Good for currency;
14.10.16 6:00 PM Core Retail Sales m/m -0.1% 0.4% Actual > Forecast = Good
for currency; USDINR
14.10.16 6:00 PM PPI m/m 0.0% 0.2% Actual > Forecast = Good
for currency; USDINR
14.10.16 6:00 PM Retail Sales m/m -0.3% 0.6% Actual > Forecast = Good
for currency; USDINR
14.10.16 Tentative BOE Gov Carney Speaks More hawkish than expected
= Good for currency;
GBPINR
14.10.16 7:30 PM Prelim UoM Consumer Senti-
ment
91.2 92.1 Actual > Forecast = Good
for currency; USDINR
14.10.16 11:00 PM Fed Chair Yellen Speaks More hawkish than expected
= Good for currency;
USDINR
5. Currency Highlights
14th
Oct’2016
SEBI Certified – Research Analyst Equities I Commodities I Currencies I Mutual Funds
Anish Vyas
Digitally signed by Anish Vyas
DN: cn=Anish Vyas, o=Choice Merchandise
Broking Pvt. Ltd, ou=Sr. Research Associate,
email=anish.vyas@choiceindia.com, c=IN
Date: 2016.10.14 08:57:46 +05'30'