NO1 Top Vashikaran Specialist in Uk Black Magic Specialist in Uk Black Magic ...
Currency high lights 23.03.17
1. Currency Highlights
23rd
March’2017
HighLights:
Indian Rupee fell from 17-mnth high to 65.45 on Wednesday
US Existing Home Sales plunged to 5.48 million in February
Euro Zone Current Account surplus of 24.1 bn Euros in Jan
Japan’s Industries Activity grew by 0.1 percent in January
Indian Rupee retreated from 17-month high and depreciated around
17 paise to end at 65.45 against the US dollar on Wednesday. The
currency depreciated on account of dollar demand from importers
and banks. Further, weak domestic market sentiments and downside
in Asian currencies kept pressure on the currency.
However, sharp downside in the Rupee was prevented due to inflow
of foreign funds in equities and debt markets. So far this year, rupee
gained 3.76%, while foreign institutional investors have bought $4.32
billion and $1.48 million from local equity and debt markets,
respectively.
Indian Rupee moved in the range of 65.34 to 65.57 in Wednesday’s trade. The Reserve Bank of India (RBI) fixed reference rate
for the dollar was seen at 65.4881 and Euro stood at 70.7206 as on 22nd Mar’17.
For the month of March 2017, FII inflows in equities totalled at Rs.20960.61 crores ($3161.70 million) as on 22nd March 2017.
Year to date basis, net capital inflows stood at Rs.29686.19 crores ($4464.14 million) as on 22nd March 2017.
US Dollar Index plunged around 0.13 percent in Wednesday’s trading session due to unfavourable economic data from the
country. Further, rise in risk appetite in global market sentiments which led to decline in demand for the low yielding currency
kept the currency in negative territory.
US Existing Home Sales plunged to 5.48 million in February with respect to rise of 5.69 million in January.
Euro against dollar fell around 0.2 percent on Wednesday on account of unfavourable economic data from the region.
However, weakness in the dollar index coupled with upbeat global market sentiments cushioned sharp fall in the currency.
Euro Zone Current Account was at a surplus of 24.1 billion Euros in January as against a surplus of 30.8 billion Euros in
December.
The Sterling Pound plunged around 0.1 percent in Wednesday’s trade on account of estimates of unfavourable economic data
from the country. However, weaker dollar along with upbeat global market sentiments prevented sharp fall in the currency.
The Japanese Yen against dollar appreciated around 0.31 percent in Wednesday’s trading session due to rise in risk aversion in
global market sentiments in early part of the trade which led to increase in demand for the low yielding currency. Japan’s
Industries Activity grew by 0.1 percent in January from a fall of 0.2 percent in December.
SEBI Certified – Research Analyst Equities I Commodities I Currencies I Mutual Funds
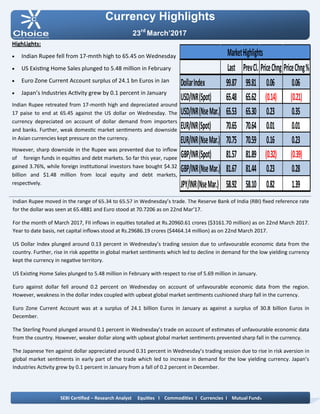
Last PrevCl. PriceChng PriceChng%
DollarIndex 99.87 99.81 0.06 0.06
USD/INR(Spot) 65.48 65.62 (0.14) (0.21)
USD/INR(NseMar.) 65.53 65.30 0.23 0.35
EUR/INR(Spot) 70.65 70.64 0.01 0.01
EUR/INR(NseMar.) 70.75 70.59 0.16 0.23
GBP/INR(Spot) 81.57 81.89 (0.32) (0.39)
GBP/INR(NseMar.) 81.67 81.44 0.23 0.28
JPY/INR(NseMar.) 58.92 58.10 0.82 1.39
MarketHighlights
2. Technical View:
On a daily chart, the pair has been trading in horizontal
channel pattern from past few months and price has
taken the support of its horizontal channel pattern at
57.25 levels.
Moreover, prices have been trading above its 10 HSMA
which gives the sign of bullishness in the prices.
On a daily chart momentum indicator, RSI is taking
support at 30 levels which indicate pullback in the prices.
In addition, momentum indicator MACD has shown
positive crossover which suggests strength in the prices
on a daily chart.
So for trading perspective, one can buy JPYINR in the
range of 58.70 with SL of 58.40 for the target of 59.30
levels.
Pivot levels for the Day
Technical View:
The pair has given a breakdown of its “Symmetrical
Triangle” pattern at 66.60 levels on a daily chart.
Moreover, prices have been trading below its 50 DSMA
which gives the sign of bearishness in the prices.
Furthermore, the price has shown a breakdown of its
consolidation range from 67.40 to 66.60 levels on a daily
chart.
A momentum indicator RSI has remained below 45
levels, which suggest further negative momentum can
be seen in the prices.
In addition, momentum indicator MACD has shown
negative crossover and moving below its signal line on a
daily chart.
So for trading perspective, one can sell USDINR in the
range of 65.60 with SL of 65.80 for the target of 65.20
levels.
Currency Highlights
23rd
March’2017
USDINR JPYINR
SEBI Certified – Research Analyst Equities I Commodities I Currencies I Mutual Funds
S3 S2 S1 Pivot R1 R2 R3
USDINR 65.15 65.34 65.43 65.53 65.62 65.72 65.91
JPYINR 57.28 58.00 58.46 58.72 59.18 59.44 60.16
3. Pivot levels for the Day
Currency Highlights
23rd
March’2017
GBPINR EURINR
Technical View:
On a daily chart, prices have been trading in falling
channel pattern from past few weeks and price has
taken the support of its lower band of channel pattern
at 69.60 levels.
The price has taken the support of its falling trend line
at 69.50 levels o daily chart.
The pair has been trading above its 10 HSMA on the
hourly chart, which suggests further positive
momentum can be seen in the prices.
On a daily chart momentum oscillator, RSI has been
taking support at 35 levels on a daily chart, which
suggests bullishness in the prices.
A momentum indicator MACD has shown positive
crossover on the hourly chart, which supports our
bullish view on the prices.
For now, we can expect prices should move higher
towards 71.30 levels in the coming trading session.
Technical View:
The pair has been trading in “Falling Wedge” pattern
from past few weeks and price has taken the support of
its lower band of the pattern at 80 levels on a daily
chart.
Moreover, prices have been trading above 10 HSMA,
which suggest short term trend looks up.
Moreover, momentum indicator MACD has given
positive crossover on the hourly chart, which gives the
sign of bullishness in the prices.
A momentum indicator RSI has been trading near its
support levels on the daily chart, which suggests the
possibilities of further upside momentum in the prices.
For now, we expect prices should move higher
towards 82.30 levels in the coming trading sessions.
SEBI Certified – Research Analyst Equities I Commodities I Currencies I Mutual Funds
S3 S2 S1 Pivot R1 R2 R3
GBPINR 81.10 81.41 81.54 81.72 81.85 82.03 82.34
EURINR 70.29 70.52 70.64 70.75 70.87 70.98 71.21
4. Currency Highlights
SEBI Certified – Research Analyst Equities I Commodities I Currencies I Mutual Funds
23rd
March’2017
Economic Indicators
Date Time Data Prior Expected Impact
23.03.17 06:20 AM Retail Sales m/m -0.3% 0.4% Actual > Forecast = Good for
currency; GBPINR
23.03.17 03:30 PM Unemployment Claims 241K 240K Actual < Forecast = Good for
currency; USDINR
23.03.17 08:30 PM Fed Chair Yellen Speaks More hawkish than expected =
Good for currency; USDINR
23.03.17 09:00 PM New Home Sales 555K 566K Actual > Forecast = Good for
currency; USDINR
5. Currency Highlights
23rd
March’2017
SEBI Certified – Research Analyst Equities I Commodities I Currencies I Mutual Funds
Anish Vyas
Digitally signed by Anish Vyas
DN: cn=Anish Vyas, o=Choice Merchandise
Broking Pvt. Ltd, ou=Sr. Research Associate,
email=anish.vyas@choiceindia.com, c=IN
Date: 2017.03.23 09:15:02 +05'30'