
Recommended
More Related Content
What's hot
What's hot (20)
Viewers also liked
Viewers also liked (15)
Similar to Currency high lights 05.05.16
Similar to Currency high lights 05.05.16 (20)
Recently uploaded
Recently uploaded (20)
Currency high lights 05.05.16
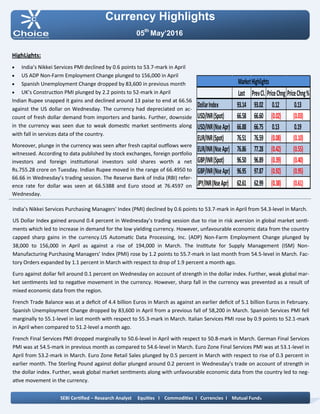
- 1. Currency Highlights 05th May’2016 HighLights: India’s Nikkei Services PMI declined by 0.6 points to 53.7-mark in April US ADP Non-Farm Employment Change plunged to 156,000 in April Spanish Unemployment Change dropped by 83,600 in previous month UK’s Construction PMI plunged by 2.2 points to 52-mark in April Indian Rupee snapped it gains and declined around 13 paise to end at 66.56 against the US dollar on Wednesday. The currency had depreciated on ac- count of fresh dollar demand from importers and banks. Further, downside in the currency was seen due to weak domestic market sentiments along with fall in services data of the country. Moreover, plunge in the currency was seen after fresh capital outflows were witnessed. According to data published by stock exchanges, foreign portfolio investors and foreign institutional investors sold shares worth a net Rs.755.28 crore on Tuesday. Indian Rupee moved in the range of 66.4950 to 66.66 in Wednesday’s trading session. The Reserve Bank of India (RBI) refer- ence rate for dollar was seen at 66.5388 and Euro stood at 76.4597 on Wednesday. India’s Nikkei Services Purchasing Managers' Index (PMI) declined by 0.6 points to 53.7-mark in April from 54.3-level in March. US Dollar Index gained around 0.4 percent in Wednesday’s trading session due to rise in risk aversion in global market senti- ments which led to increase in demand for the low yielding currency. However, unfavourable economic data from the country capped sharp gains in the currency.US Automatic Data Processing, Inc. (ADP) Non-Farm Employment Change plunged by 38,000 to 156,000 in April as against a rise of 194,000 in March. The Institute for Supply Management (ISM) Non- Manufacturing Purchasing Managers' Index (PMI) rose by 1.2 points to 55.7-mark in last month from 54.5-level in March. Fac- tory Orders expanded by 1.1 percent in March with respect to drop of 1.9 percent a month ago. Euro against dollar fell around 0.1 percent on Wednesday on account of strength in the dollar index. Further, weak global mar- ket sentiments led to negative movement in the currency. However, sharp fall in the currency was prevented as a result of mixed economic data from the region. French Trade Balance was at a deficit of 4.4 billion Euros in March as against an earlier deficit of 5.1 billion Euros in February. Spanish Unemployment Change dropped by 83,600 in April from a previous fall of 58,200 in March. Spanish Services PMI fell marginally to 55.1-level in last month with respect to 55.3-mark in March. Italian Services PMI rose by 0.9 points to 52.1-mark in April when compared to 51.2-level a month ago. French Final Services PMI dropped marginally to 50.6-level in April with respect to 50.8-mark in March. German Final Services PMI was at 54.5-mark in previous month as compared to 54.6-level in March. Euro Zone Final Services PMI was at 53.1-level in April from 53.2-mark in March. Euro Zone Retail Sales plunged by 0.5 percent in March with respect to rise of 0.3 percent in earlier month. The Sterling Pound against dollar plunged around 0.2 percent in Wednesday’s trade on account of strength in the dollar index. Further, weak global market sentiments along with unfavourable economic data from the country led to neg- ative movement in the currency. SEBI Certified – Research Analyst Equities I Commodities I Currencies I Mutual Funds Last PrevCl. PriceChng PriceChng% DollarIndex 93.14 93.02 0.12 0.13 USD/INR(Spot) 66.58 66.60 (0.02) (0.03) USD/INR(NseApr) 66.88 66.75 0.13 0.19 EUR/INR(Spot) 76.51 76.59 (0.08) (0.10) EUR/INR(NseApr) 76.86 77.28 (0.42) (0.55) GBP/INR(Spot) 96.50 96.89 (0.39) (0.40) GBP/INR(NseApr) 96.95 97.87 (0.92) (0.95) JPY/INR(NseApr) 62.61 62.99 (0.38) (0.61) MarketHighlights
- 2. Technical View: The JPYINR price has shown breakout of its rising channel pattern 62.40 levels. Price has retested the upper band of channel pattern at 62.40 levels on y chart. Moreover, Pair has been trading above its 50 hourly exponential moving average which suggest short term trend remains up. On daily chart, momentum oscillator RSI has given breakout of its falling trend line at 50 levels which suggest more buying opportunity can be seen on lower side. A momentum indicator MACD has shown positive crossover on hourly chart, which indicates short term trend remains positive . For now we expect prices to move higher towards 63 levels in few trading sessions. Pivot levels for the Day Technical View: The USDINR price has been trading in rising channel for- mation form past few week and price has taken support of lower band of channel at 66.60 levels on hurly chart. On daily chart, USDINR has been taking support of its horizontal trends line at 66.24 levels. Moreover, price have been trading above its 60 Hourly exponential moving average so any dips upto 66.80 level, it would become the best buying opportuni- ty in near term. A momentum indicator RSI has been trading above 60 levels on hourly chart, which suggest bullishness in the prices. Momentum indictor MACD has shown positive crossover and moved above single line on hourly chart, which gives positive confirmation to the prices. For now we expect prices to move higher towards 67.35 lev- els in few trading sessions. Currency Highlights 05th May’2016 USDINR JPYINR SEBI Certified – Research Analyst Equities I Commodities I Currencies I Mutual Funds S3 S2 S1 Pivot R1 R2 R3 USDINR 66.54 66.71 66.80 66.88 66.97 67.05 67.22 JPYINR 61.82 62.17 62.39 62.52 62.74 62.87 63.22
- 3. Pivot levels for the Day Currency Highlights 05th May’2016 GBPINR EURINR Technical View: The price has been trading in rising channel formation and taking support of lower band of channel pattern 75.60 levels. The pair has been trading in acceding triangle formation on daily chart. The price has given breakout its symmetrical pattern at 76.10 levels on hourly chart. On the other hand, Pair has been trading above its 50 daily exponential moving average which indicates that trend is remains up. On daily chart, GBPINR has shown breakout of its rectangle pattern at 76.40 levels. A momentum oscillator RSI have been trading above 60 levels on hourly chart which gives bullishness to the prices. Moreover, momentum indicator MACD has shown positive crossover on four hourly chart which support our bullish view on the pair. Technical View: The price has given breakout its rectangle pattern at 96.70 levels on daily chart. O The pair has almost rested the upper band of pattern at 96.80 levels on daily chart. n the other hand, Pair has been trading above its 100 daily exponential moving average which indicates that trend is remains up. On daily chart, GBPINR has given breakout of its falling trend lien at 96.80 levels . A momentum oscillator RSI have been trading above 60 levels on hourly chart which gives bullish- ness to the prices. Moreover, momentum indicator MACD has shown positive crossover on four hourly chart which support our bullish view on the pair. For now we expect prices should move higher towards 97.40 levels in the coming trading sessions. SEBI Certified – Research Analyst Equities I Commodities I Currencies I Mutual Funds S3 S2 S1 Pivot R1 R2 R3 GBPINR 95.94 96.48 96.71 97.02 97.25 97.56 98.10 EURINR 76.34 76.59 76.72 76.84 76.97 77.09 77.34
- 4. Currency Highlights SEBI Certified – Research Analyst Equities I Commodities I Currencies I Mutual Funds Economic Indicators Date Time Data Prior Expected Impact 03.05.16 7:15am Caixin Manufacturing PMI 49.7 49.8 Actual > Forecast = Good for currency; Yuan 03.05.16 2:00pm Manufacturing PMI 51.0 51.3 Actual > Forecast = Good for currency; GBPINR 03.05.16 8:00pm FOMC Member Mester Speaks 05th May’2016
- 5. Currency Highlights 05th May’2016 SEBI Certified – Research Analyst Equities I Commodities I Currencies I Mutual Funds Amit Pathania Digitally signed by Amit Pathania DN: cn=Amit Pathania, o=Choice Equity Broking Pvt. ltd, ou=Research Department, email=amit.pathania@choiceindia.com, c=IN Date: 2016.05.05 08:30:47 +05'30'