
Recommended
More Related Content
What's hot
What's hot (20)
Similar to Currency high lights 07.07.16
Similar to Currency high lights 07.07.16 (20)
Recently uploaded
Recently uploaded (20)
Currency high lights 07.07.16
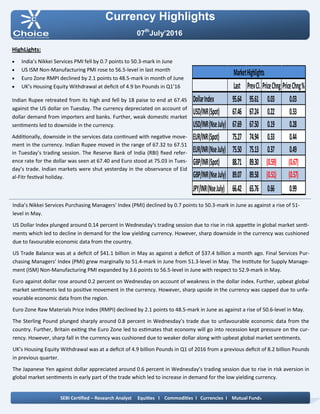
- 1. Currency Highlights 07th July’2016 HighLights: India’s Nikkei Services PMI fell by 0.7 points to 50.3-mark in June US ISM Non-Manufacturing PMI rose to 56.5-level in last month Euro Zone RMPI declined by 2.1 points to 48.5-mark in month of June UK’s Housing Equity Withdrawal at deficit of 4.9 bn Pounds in Q1’16 Indian Rupee retreated from its high and fell by 18 paise to end at 67.45 against the US dollar on Tuesday. The currency depreciated on account of dollar demand from importers and banks. Further, weak domestic market sentiments led to downside in the currency. Additionally, downside in the services data continued with negative move- ment in the currency. Indian Rupee moved in the range of 67.32 to 67.51 in Tuesday’s trading session. The Reserve Bank of India (RBI) fixed refer- ence rate for the dollar was seen at 67.40 and Euro stood at 75.03 in Tues- day’s trade. Indian markets were shut yesterday in the observance of Eid al-Fitr festival holiday. India’s Nikkei Services Purchasing Managers' Index (PMI) declined by 0.7 points to 50.3-mark in June as against a rise of 51- level in May. US Dollar Index plunged around 0.14 percent in Wednesday‘s trading session due to rise in risk appetite in global market senti- ments which led to decline in demand for the low yielding currency. However, sharp downside in the currency was cushioned due to favourable economic data from the country. US Trade Balance was at a deficit of $41.1 billion in May as against a deficit of $37.4 billion a month ago. Final Services Pur- chasing Managers' Index (PMI) grew marginally to 51.4-mark in June from 51.3-level in May. The Institute for Supply Manage- ment (ISM) Non-Manufacturing PMI expanded by 3.6 points to 56.5-level in June with respect to 52.9-mark in May. Euro against dollar rose around 0.2 percent on Wednesday on account of weakness in the dollar index. Further, upbeat global market sentiments led to positive movement in the currency. However, sharp upside in the currency was capped due to unfa- vourable economic data from the region. Euro Zone Raw Materials Price Index (RMPI) declined by 2.1 points to 48.5-mark in June as against a rise of 50.6-level in May. The Sterling Pound plunged sharply around 0.8 percent in Wednesday’s trade due to unfavourable economic data from the country. Further, Britain exiting the Euro Zone led to estimates that economy will go into recession kept pressure on the cur- rency. However, sharp fall in the currency was cushioned due to weaker dollar along with upbeat global market sentiments. UK’s Housing Equity Withdrawal was at a deficit of 4.9 billion Pounds in Q1 of 2016 from a previous deficit of 8.2 billion Pounds in previous quarter. The Japanese Yen against dollar appreciated around 0.6 percent in Wednesday’s trading session due to rise in risk aversion in global market sentiments in early part of the trade which led to increase in demand for the low yielding currency. SEBI Certified – Research Analyst Equities I Commodities I Currencies I Mutual Funds Last PrevCl. PriceChng PriceChng% DollarIndex 95.64 95.61 0.03 0.03 USD/INR(Spot) 67.46 67.24 0.22 0.33 USD/INR(NseJuly) 67.69 67.50 0.19 0.28 EUR/INR(Spot) 75.27 74.94 0.33 0.44 EUR/INR(NseJuly) 75.50 75.13 0.37 0.49 GBP/INR(Spot) 88.71 89.30 (0.59) (0.67) GBP/INR(NseJuly) 89.07 89.58 (0.51) (0.57) JPY/INR(NseJuly) 66.42 65.76 0.66 0.99 MarketHighlights
- 2. Technical View: The pair has shown breakout of its rising wedge pattern at 65.50 levels on daily chart. The price has retested its breakout levels on daily chart, which indicates further upside momen- tum in the prices. In addition, on daily chart prices have been trading above its 21 daily exponential moving average which gives the positive confirmation to the prices. On daily chart, momentum oscillator RSI has remained above 60 levels, which gives positive confirmation to the prices. A momentum indicator MACD has shown positive crossover on daily chart, which indicates short term trend remains bull- ish. For now we expect prices to move higher towards 66.70 lev- els in few trading sessions. Pivot levels for the Day Technical View: The price has been trading in its rising channel formation from past few months and price has faced resistance of its upper band at 68.50 levels on daily chart. Price has faced re- sistance of its horizontal trend line at 68 levels on daily. Moreover, price have been trading below its 21 daily expo- nential moving average which suggest near term remains down. So any rally in the prices towards 67.85 level, used as selling opportunity. A momentum indicator RSI has moved below 60 levels on daily chart, which suggest bearishness in the prices. A momentum indictor MACD has given negative signs on dai- ly chart, which gives negative confirmation to the prices. For now we expect prices to move lower towards 67.20 lev- els in few trading sessions. Currency Highlights 07th July’2016 USDINR JPYINR SEBI Certified – Research Analyst Equities I Commodities I Currencies I Mutual Funds S3 S2 S1 Pivot R1 R2 R3 USDINR 67.23 67.44 67.57 67.65 67.78 67.86 68.07 JPYINR 65.36 65.86 66.14 66.36 66.64 66.86 67.36
- 3. Pivot levels for the Day Currency Highlights 07th July’2016 GBPINR EURINR Technical View: The price has shown breakout of its symmetrical triangle patter at 75.50 levels on daily chart. he price has shown breakdown of its rising channel pattern at 75.50 levels on daily chart. On the other hand, Pair has been trading below its 21 daily exponential moving average which indicates that trend is remains down. A momentum oscillator RSI have been trading below 45 lev- els on daily chart which gives the signs of bearishness to the prices. Moreover, momentum indicator MACD has shown negative crossover on daily chart which support our bearish view on the pair. For now we expect prices should move lower towards 74.60 levels in the coming trading sessions. Technical View: The price has shown breakdown of its horizontal channel pattern at 94 levels on daily chart. So any rally in the prices towards 91.50 level, used as selling opportunity. On the other hand, pair has been trading below its 50 daily exponential moving average which indicates that short term trend is remains bearish. The price has given breakdown of its horizontal trend line at 90.50 levels on daily chart. A momentum indicator RSI has moved below 45 levels on daily chart, which suggest bearishness in the prices. Moreover, momentum indicator MACD has shown negative crossover on daily chart which support our bearish view on the pair. For now we expect prices should move lower towards 89 levels in the coming trading sessions. SEBI Certified – Research Analyst Equities I Commodities I Currencies I Mutual Funds S3 S2 S1 Pivot R1 R2 R3 GBPINR 87.65 88.44 88.76 89.23 89.55 90.02 90.81 EURINR 74.32 74.87 75.18 75.42 75.73 75.97 76.52
- 4. Currency Highlights SEBI Certified – Research Analyst Equities I Commodities I Currencies I Mutual Funds Economic Indicators Date Time Data Prior Expected Impact 07.07.16 6:00am BOJ Gov Kuroda Speaks 07.07.16 1:00pm Halifax HPI m/m 0.6% 0.4% Actual > Forecast = Good for currency; GBPINR 07.07.16 2:00pm Manufacturing Production m/m 2.3% -1.2% Actual > Forecast = Good for currency; GBPINR 07.07.16 5:00pm ECB Monetary Policy Meeting Accounts 07.07.16 5:45pm ADP Non-Farm Employment Change 173K 158K Actual > Forecast = Good for currency; USDINR 07.07.16 6:00pm Unemployment Claims 268K 269K Actual < Forecast = Good for currency; USDINR 07.07.16 8:30pm Crude Oil Inventories -4.1M Actual < Forecast = Good for Crude Oil 07th July’2016
- 5. Currency Highlights 07th July’2016 SEBI Certified – Research Analyst Equities I Commodities I Currencies I Mutual Funds Amit Pathania Digitally signed by Amit Pathania DN: cn=Amit Pathania, o=Choice Equity Broking Pvt. ltd, ou=Research Department, email=amit.pathania@choiceindia.com, c=IN Date: 2016.07.07 08:50:40 +05'30'