( Jasmin ) Top VIP Escorts Service Dindigul 💧 7737669865 💧 by Dindigul Call G...
Currency high lights 04.11.16
1. Currency Highlights
04th
Nov’2016
HighLights:
India’s Nikkei Services PMI increased to 54.5-mark in October
US Unemployment Claims rose to 265,000 for w/e on 28th
Oct’16
Spanish Unemployment Change surged to 44,700 in last month
UK’s Services PMI gained by 1.9 points to 54.5-mark in October
US ISM Non-Manufacturing PMI fell to 54.8-mark in October
Indian Rupee was under pressure and depreciated marginally by 3 pai-
se to end at 66.74 against the US dollar on Thursday. The currency
depreciated on account of dollar demand from banks and importers.
Further, weak domestic market sentiments kept pressure on the cur-
rency. Outflow of foreign funds from equities and debt markets con-
tinued with negative movement in the currency. Foreign institutional
investors (FIIs) have sold $746.30 million in debt and bought $6.75
billion in equity till date this year. However, sharp downside in the
currency was prevented as a result of favourable economic data from
the country. Indian Rupee moved in the range of 66.6675 to 66.7750
in Thursday’s trade.
India’s Nikkei Services Purchasing Managers' Index (PMI) increased by 2.5 points to 54.5-mark in October as against a rise of 52
-level in September.
US Dollar Index fell around 0.22 percent in Thursday’s trading session due to unfavourable economic data from the country.
However, sharp downside in the currency was cushioned as a result of rise in risk aversion in global markets which led to in-
crease in demand for the low yielding currency.US Unemployment Claims increased by 7,000 to 265,000 for the week ending
on 28th
Oct’16 as against a rise of 258,000 in prior week. Prelim Nonfarm Productivity rose by 3.1 percent in Q3 of 2016 from a
decline of 0.6 percent in previous quarter. Prelim Unit Labor Costs fell by 0.3 percent for the quarter ending on September as
compared to 4.3 percent in earlier quarter. The Institute for Supply Management (ISM) Non-Manufacturing PMI plunged by
2.3 points to 54.8-mark in October with respect to 57.1-level in September. Factory Orders expanded by 0.3 percent in Sep-
tember when compared to 0.2 percent in August.
Euro against dollar rose around 0.1 percent on Thursday on account of weakness in the dollar index. However, weak domestic
market sentiments along with unfavourable economic data from the region capped sharp gain in the currency. Spanish Unem-
ployment Change surged by 21,900 to 44,700 in October as against a rise of 22,800 in September. Euro Zone Unemployment
Rate unchanged at 10 percent in September.
The Sterling Pound grew by more than 1 percent in Thursday’s trade after UK high court said that Parliament needs to decide
on Brexit. Further, favourable economic data from the country coupled with weaker dollar led to upside in the currency. How-
ever, weak global market sentiments capped sharp gains in the currency. UK’s Services PMI gained by 1.9 points to 54.5-mark
in October from 52.6-level in September. Official Bank Rate unchanged at 0.25 percent in November meeting. Asset Purchase
Facility also remained at 435 billion Pounds in current month.
The Japanese Yen against dollar appreciated around 0.32 percent in Thursday’s trading session due to rise in risk aversion in
global market sentiments which led to increase in demand for the low yielding currency.
SEBI Certified – Research Analyst Equities I Commodities I Currencies I Mutual Funds
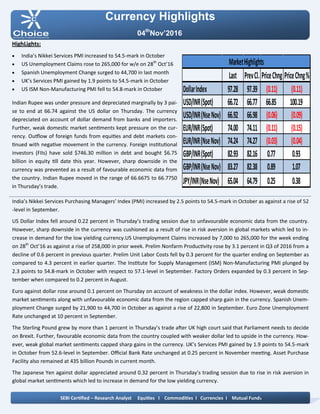
Last PrevCl. PriceChng PriceChng%
DollarIndex 97.28 97.39 (0.11) (0.11)
USD/INR(Spot) 66.72 66.77 66.85 100.19
USD/INR(NseNov) 66.92 66.98 (0.06) (0.09)
EUR/INR(Spot) 74.00 74.11 (0.11) (0.15)
EUR/INR(NseNov) 74.24 74.27 (0.03) (0.04)
GBP/INR(Spot) 82.93 82.16 0.77 0.93
GBP/INR(NseNov) 83.27 82.38 0.89 1.07
JPY/INR(NseNov) 65.04 64.79 0.25 0.38
MarketHighlights
2. Technical View:
On daily chart JPYINR prices have been trading in sym-
metrical triangle pattern and shown breakdown of its
symmetrical triangle pattern.
Moreover, price has shown breakdown of its rising trend
line at 65 levels on daily chart.
Furthermore, prices have been trading below its 50 DE-
MA, which suggest short term trend is negative.
On daily chart momentum indicator RSI is trading below
at 45 levels which suggest further weakness in the pric-
es.
In addition, momentum indicator MACD has shown neg-
ative crossover on daily chart.
So for trading perspective, one could use sell in the
range of 65 with SL of 65.40 for target of 64.20 levels.
Pivot levels for the Day
Technical View:
The pair has been trading in horizontal channel pattern
from past few months and prices have been facing re-
sistance of its upper band at 67.30levels on daily chart.
On daily USDINR prices have been facing resistance of
its falling trend line at 67.30 levels.
On the other hand, prices have been facing resistance of
horizontal trend line at 67.40 levels on daily chart.
Moreover, prices have been trading below 21 HEMA
which gives the sign of bearishness in the prices.
A momentum indictor RSI has traded below 60 levels,
which suggest further weakness in the prices.
In addition, momentum indicator MACD has shown neg-
ative crossover on daily chart.
So for trading perspective, one could sell in range 67.05
with SL of 67.40 for target of 66.40.
Currency Highlights
04th
Nov’2016
USDINR JPYINR
SEBI Certified – Research Analyst Equities I Commodities I Currencies I Mutual Funds
S3 S2 S1 Pivot R1 R2 R3
USDINR 66.69 66.81 66.87 66.93 66.99 67.05 67.17
JPYINR 64.27 64.62 64.70 64.97 65.05 65.32 65.67
3. Pivot levels for the Day
Currency Highlights
04th
Nov’2016
GBPINR EURINR
Technical View:
The EURINR pair has shown breakdown of its descend-
ing triangle pattern at 74 levels on daily chart. On the
other hand price has shown breakdown of its symmet-
rical triangle pattern at 74.80 levels on daily chart.
Moreover, prices have been trading below its 50 DE-
MA, which suggest short term trend is down. The pair
has shown breakdown of its horizontal trend line at
74.70 levels on daily chart.
On daily chart momentum oscillator RSI have been trad-
ing below 60 which suggest bearishness in the prices.
A momentum indicator MACD has shown negative
crossover on daily chart, which add more bearishness in
the prices.
For now we can expect prices should move lower to-
wards 73.70 levels in the coming trading session.
Technical View:
The pair has been trading in falling channel pattern
form pas few months and price has taken support of its
lower band of channel pattern at 81.80 levels on daily
chart. Moreover, prices have been trading below 21 HE-
MA, which suggest short term trend looks positive.
The price has formed bullish hammer candle stick
pattern on daily chart, which is bullish pattern.
A momentum indicator MADC has given positive Cross
over on hourly chart, which gives the sign of bullishness
in the prices.
The momentum indictor RSI has been trading in over-
sold zone levels on daily chart, which suggest the possi-
bilities of bounce back in the in the prices.
For now we expect prices should move higher towards
84.10 levels coming trading sessions.
SEBI Certified – Research Analyst Equities I Commodities I Currencies I Mutual Funds
S3 S2 S1 Pivot R1 R2 R3
GBPINR 81.38 82.26 82.78 83.14 83.66 84.02 84.90
EURINR 73.80 74.06 74.15 74.32 74.41 74.58 74.84
4. Currency Highlights
SEBI Certified – Research Analyst Equities I Commodities I Currencies I Mutual Funds
04th
Nov’2016
Economic Indicators
Date Time Data Prior Expected Impact
04.11.16 02:30 PM Final Services PMI 53.5 53.5 Actual > Forecast = Good
for currency; EURINR
04.11.16 03:30 PM PPI m/m -0.2% 0.0% Actual > Forecast = Good
for currency; EURINR
04.11.16 06:00 PM Average Hourly Earnings m/
m
52.3 51.9 Actual > Forecast = Good
for currency; USDINR
04.11.16 06:00 PM Non-Farm Employment
Change
156K 174K Actual > Forecast = Good
for currency; USDINR
04.11.16 06:00 PM Unemployment Rate 0.25% 0.25% Actual > Forecast = Good
for currency; USDINR
04.11.16 06:00 PM Trade Balance 5.0% 4.9% Actual > Forecast = Good
for currency; USDINR
5. Currency Highlights
04th
Nov’2016
SEBI Certified – Research Analyst Equities I Commodities I Currencies I Mutual Funds
Amit Pathania
Digitally signed by Amit Pathania
DN: cn=Amit Pathania, o=Choice Equity Broking Pvt. ltd,
ou=Research Department, email=amit.pathania@choiceindia.com,
c=IN
Date: 2016.11.04 09:08:00 +05'30'