VIP Independent Call Girls in Bandra West 🌹 9920725232 ( Call Me ) Mumbai Esc...
Currency high lights 19.05.16
1. Currency Highlights
19th
May’2016
HighLights:
Indian Rupee dropped for fifth consecutive day on Wednesday
Euro Zone Final CPI dropped by 0.2 percent in the month of April
UK’s Claimant Count Change plunged by 2,400 in the last month
Japan’s Prelim Gross Domestic Product (GDP) rose by 0.4 percent in
Q1 of 2016
Indian Rupee continued to be under pressure and declined for fifth con-
secutive day to depreciate by 11 paise to end 66.98 against the US dollar
on Wednesday. The currency had depreciated on account of fresh dollar
demand from oil importers and banks. Additionally, concerns over outflow
of the foreign capital led to negative movement in the currency.
Further, downside in the domestic market sentiments coupled with
strength in the dollar index kept pressure on the currency. Indian Rupee
moved in the range of 66.87 to 67.0 in Wednesday’s trading session. The
Reserve Bank of India (RBI) reference rate for dollar was seen at 66.91 and
Euro stood at 75.48 on Wednesday.
US Dollar Index gained sharply around 0.7 percent in Wednesday’s trading session due to rise in risk aversion in global market
sentiments which led to increase in demand for the low yielding currency.
Euro against dollar plunged around 0.8 percent on Wednesday on account of weak global market sentiments in later part of
the trade. Further, strength in the dollar index kept pressure on the currency.
However, sharp downside in the currency was cushioned due to favourable economic data from the country.
Euro Zone Final Consumer Price Index (CPI) dropped by 0.2 percent in the month of April. Final Core CPI fell to 0.7 percent in
April as against a rise of 0.8 percent in March.
The Sterling Pound against dollar gained around 0.9 percent in Wednesday’s trade on account of favourable economic data
from the country.
However, fall in the global market sentiments in later part of the trade along with strength in the dollar index capped sharp
gains in the currency.
UK’s Average Earnings Index increased to 2 percent in March as against a rise of 1.9 percent in February. Claimant Count
Change plunged by 2,400 in April from a previous rise of 14,700 in March. Unemployment Rate remained unchanged at 5.1
percent in the month of March.
The Japanese Yen against dollar depreciated around 1 percent in yesterday’s trade due to rise in risk appetite in global market
sentiments in early part of the trade which led to decline in demand for the low yielding currency.
However, favourable economic data from the country prevented sharp fall in the currency.
Japan’s Core Machinery Orders gained by 5.5 percent in March as against a decline of 9.2 percent a month ago.
SEBI Certified – Research Analyst Equities I Commodities I Currencies I Mutual Funds
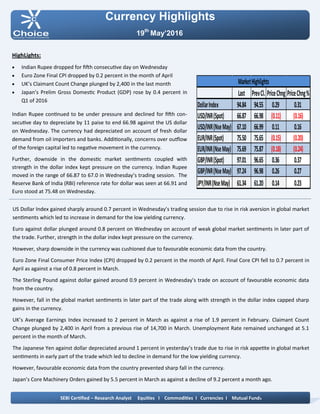
Last PrevCl. PriceChng PriceChng%
DollarIndex 94.84 94.55 0.29 0.31
USD/INR(Spot) 66.87 66.98 (0.11) (0.16)
USD/INR(NseMay) 67.10 66.99 0.11 0.16
EUR/INR(Spot) 75.50 75.65 (0.15) (0.20)
EUR/INR(NseMay) 75.69 75.87 (0.18) (0.24)
GBP/INR(Spot) 97.01 96.65 0.36 0.37
GBP/INR(NseMay) 97.24 96.98 0.26 0.27
JPY/INR(NseMay) 61.34 61.20 0.14 0.23
MarketHighlights
2. Technical View:
The JPYINR price has been taking support of rising trend line
at 61 levels on hourly chart. Prices have been taking support
of 50% Fibonacci retracement levels form its previous rally of
58 to 63 levels.
Moreover, Pair has been trading above its 21 hourly exponen-
tial moving average which suggest short term trend remains
up.
On hourly chart, momentum oscillator RSI has moved above
its 45 levels, which gives positive confirmation to the prices.
A momentum indicator MACD has shown positive crossover
on hourly chart, which indicates short term trend remains
Bullish.
Pivot levels for the Day
Technical View:
The price has shown breakout of its ascending triangle a
pattern at 66.90 levels on daily chart with bolstering volumes.
The pair has given breakout of its head and shoulder neckline
pattern at 66.95 levels on daily chart.
Moreover, price have been trading above its 50 daily expo-
nential moving average which suggest near term trend re-
mains positive. So any dips in the prices lower towards 66.80
level, used as buying opportunity.
A momentum indicator RSI has been taking support at 50
levels on daily chart, which suggest bullishness in the prices.
Momentum indictor MACD has shown positive crossover and
trading above single line on hourly chart, which gives posi-
tive confirmation to the prices.
For now we expect prices to move higher towards 67.35 lev-
els in few trading sessions.
Currency Highlights
19th
May’2016
USDINR JPYINR
SEBI Certified – Research Analyst Equities I Commodities I Currencies I Mutual Funds
S3 S2 S1 Pivot R1 R2 R3
USDINR 66.79 66.93 67.01 67.07 67.15 67.21 67.35
JPYINR 60.71 61.03 61.19 61.35 61.51 61.67 61.99
3. Pivot levels for the Day
Currency Highlights
19th
May’2016
GBPINR EURINR
Technical View:
The pair has given breakdown of its rising trend line at 75.80
levels and price has retested the breakdown trend line at
75.80 levels. Price has given breakdown of its symmetrical
triangle pattern on 4 hourly chart at 76 levels. On the other
hand, Pair has been trading below its 50 hourly exponential
moving average which indicates that trend is remains weak.
A momentum oscillator RSI have been trading below 60 lev-
els on 4 hourly chart which gives bearishness to the prices.
Moreover, momentum indicator MACD has shown negative
crossover on four hourly chart which support our bearish
view on the pair.
For now we expect prices should move lower towards 75.30
levels in the coming trading sessions.
Technical View:
The price has been trading in falling channel pattern and fac-
ing resistance of upper trend line at 98 levels on hourly
chart. Moreover, price has formed evening star candle stick
pattern on daily chart. Price has faced resistance of its hori-
zontal trend line at 97 levels on hourly chart.
On the other hand, Pair has been trading below its 21 hourly
exponential moving average which indicates that short term
trend is remains bearish.
A momentum oscillator RSI have been trading below 60 lev-
els on hourly chart which gives bullishness to the prices.
Moreover, momentum indicator MACD has shown negative
crossover on hourly chart and traded above of its signal line
which support our bearish view on the pair.
SEBI Certified – Research Analyst Equities I Commodities I Currencies I Mutual Funds
S3 S2 S1 Pivot R1 R2 R3
GBPINR 95.74 96.40 96.84 97.06 97.50 97.72 98.38
EURINR 75.12 75.39 75.54 75.66 75.81 75.93 76.20
4. Currency Highlights
SEBI Certified – Research Analyst Equities I Commodities I Currencies I Mutual Funds
Economic Indicators
Date Time Data Prior Expected Impact
19.05.16 12:30am MPC Member Haldane Speaks
19.05.16 2:00pm Retail Sales m/m -1.3% 0.6% Actual > Forecast = Good for
currency; GBPINR
19.05.16 5:00pm ECB Monetary Policy Meeting
Accounts
19.05.16 6:00pm Philly Fed Manufacturing Index -1.6 3.2 Actual > Forecast = Good for
currency; USDINR
19.05.16 6:00pm Unemployment Claims 294K 276K Actual > Forecast = Good for
currency; USDINR
19.05.16 6:45pm FOMC Member Fischer Speaks
19.05.16 8:00pm FOMC Member Dudley Speaks
19.05.16 10:30pm MPC Member Vlieghe Speaks
19th
May’2016
5. Currency Highlights
19th
May’2016
SEBI Certified – Research Analyst Equities I Commodities I Currencies I Mutual Funds
Amit Pathania
Digitally signed by Amit Pathania
DN: cn=Amit Pathania, o=Choice Equity Broking Pvt. ltd, ou=Research
Department, email=amit.pathania@choiceindia.com, c=IN
Date: 2016.05.19 08:20:12 +05'30'