
Recommended
More Related Content
What's hot
What's hot (20)
Similar to Currency high lights 17.05.16
Similar to Currency high lights 17.05.16 (18)
Recently uploaded
Recently uploaded (20)
Currency high lights 17.05.16
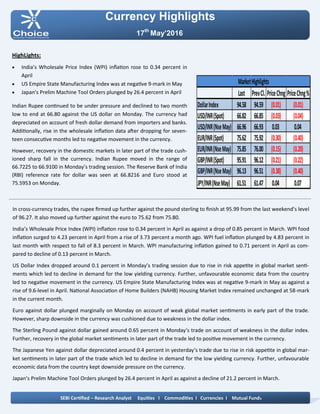
- 1. Currency Highlights 17th May’2016 HighLights: India’s Wholesale Price Index (WPI) inflation rose to 0.34 percent in April US Empire State Manufacturing Index was at negative 9-mark in May Japan’s Prelim Machine Tool Orders plunged by 26.4 percent in April Indian Rupee continued to be under pressure and declined to two month low to end at 66.80 against the US dollar on Monday. The currency had depreciated on account of fresh dollar demand from importers and banks. Additionally, rise in the wholesale inflation data after dropping for seven- teen consecutive months led to negative movement in the currency. However, recovery in the domestic markets in later part of the trade cush- ioned sharp fall in the currency. Indian Rupee moved in the range of 66.7225 to 66.9100 in Monday’s trading session. The Reserve Bank of India (RBI) reference rate for dollar was seen at 66.8216 and Euro stood at 75.5953 on Monday. In cross-currency trades, the rupee firmed up further against the pound sterling to finish at 95.99 from the last weekend’s level of 96.27. It also moved up further against the euro to 75.62 from 75.80. India’s Wholesale Price Index (WPI) inflation rose to 0.34 percent in April as against a drop of 0.85 percent in March. WPI food inflation surged to 4.23 percent in April from a rise of 3.73 percent a month ago. WPI fuel inflation plunged by 4.83 percent in last month with respect to fall of 8.3 percent in March. WPI manufacturing inflation gained to 0.71 percent in April as com- pared to decline of 0.13 percent in March. US Dollar Index dropped around 0.1 percent in Monday’s trading session due to rise in risk appetite in global market senti- ments which led to decline in demand for the low yielding currency. Further, unfavourable economic data from the country led to negative movement in the currency. US Empire State Manufacturing Index was at negative 9-mark in May as against a rise of 9.6-level in April. National Association of Home Builders (NAHB) Housing Market Index remained unchanged at 58-mark in the current month. Euro against dollar plunged marginally on Monday on account of weak global market sentiments in early part of the trade. However, sharp downside in the currency was cushioned due to weakness in the dollar index. The Sterling Pound against dollar gained around 0.65 percent in Monday’s trade on account of weakness in the dollar index. Further, recovery in the global market sentiments in later part of the trade led to positive movement in the currency. The Japanese Yen against dollar depreciated around 0.4 percent in yesterday’s trade due to rise in risk appetite in global mar- ket sentiments in later part of the trade which led to decline in demand for the low yielding currency. Further, unfavourable economic data from the country kept downside pressure on the currency. Japan’s Prelim Machine Tool Orders plunged by 26.4 percent in April as against a decline of 21.2 percent in March. SEBI Certified – Research Analyst Equities I Commodities I Currencies I Mutual Funds Last PrevCl. PriceChng PriceChng% DollarIndex 94.58 94.59 (0.01) (0.01) USD/INR(Spot) 66.82 66.85 (0.03) (0.04) USD/INR(NseMay) 66.96 66.93 0.03 0.04 EUR/INR(Spot) 75.62 75.92 (0.30) (0.40) EUR/INR(NseMay) 75.85 76.00 (0.15) (0.20) GBP/INR(Spot) 95.91 96.12 (0.21) (0.22) GBP/INR(NseMay) 96.13 96.51 (0.38) (0.40) JPY/INR(NseMay) 61.51 61.47 0.04 0.07 MarketHighlights
- 2. Technical View: The JPYINR price has been trading in rising wedge formation form past few weeks. Price has faced resistance of upper band of wedge pattern at 62.80 levels on 4 hourly chart. Pric- es have been facing resistance of horizontal trend line at 62.10 levels on 4 hourly chart. Moreover, Pair has been trading below its 60 hourly exponen- tial moving average which suggest short term trend remains down. On 4 hourly chart, momentum oscillator RSI has moved be- low 60 levels, which gives negative confirmation to the prices. A momentum indicator MACD has shown negative crossover on 4 hourly chart, which indicates short term trend remains negative. Pivot levels for the Day Technical View: The price has been moving in rectangle pattern form past few months and facing resistance at 67.20 levels on 4 hourly chart. Moreover, price have been trading below its 21 hourly expo- nential moving average which suggest near term trend re- mains weak. So any rally towards 67.95 level, used as selling opportunity. A momentum indicator RSI has been trading below 60 levels on 4 hourly chart, which suggest bearishness in the prices. Momentum indictor MACD has shown negative crossover and trading below single line on 4 hourly chart, which gives negative confirmation to the prices. For now we expect prices to move lower towards 66.50 lev- els in few trading sessions. Currency Highlights 17th May’2016 USDINR JPYINR SEBI Certified – Research Analyst Equities I Commodities I Currencies I Mutual Funds S3 S2 S1 Pivot R1 R2 R3 USDINR 66.54 66.75 66.86 66.96 67.07 67.17 67.38 JPYINR 61.04 61.29 61.40 61.54 61.65 61.79 62.04
- 3. Pivot levels for the Day Currency Highlights 17th May’2016 GBPINR EURINR Technical View: Price has given breakdown of its symmetrical triangle pattern on 4 hourly chart at 75.50 levels. On the other hand, Pair has been trading below its 50 hourly exponential moving average which indicates that trend is remains weak. A momentum oscillator RSI have been trading below 60 lev- els on 4 hourly chart which gives bearishness to the prices. Moreover, momentum indicator MACD has shown negative crossover on four hourly chart which support our bearish view on the pair. For now we expect prices should move lower towards 75.10 levels in the coming trading sessions. Technical View: The price has been trading in falling channel pattern and fac- ing resistance of upper trend line at 98 levels on 4 hourly chart. Moreover, price has formed bearish harami pattern on hourly chart. Price has faced resistance of its horizontal trend line at 97 levels on 4 hourly chart. On the other hand, Pair has been trading below its 21 hourly exponential moving average which indicates that short term trend is remains bearish. A momentum oscillator RSI have been trading below 60 lev- els on 4 hourly chart which gives bullishness to the prices. Moreover, momentum indicator MACD has shown negative crossover on 4 hourly chart and traded above of its signal line which support our bearish view on the pair. SEBI Certified – Research Analyst Equities I Commodities I Currencies I Mutual Funds S3 S2 S1 Pivot R1 R2 R3 GBPINR 95.19 95.68 95.89 96.17 96.38 96.66 97.15 EURINR 75.32 75.58 75.71 75.84 75.97 76.10 76.36
- 4. Currency Highlights SEBI Certified – Research Analyst Equities I Commodities I Currencies I Mutual Funds Economic Indicators Date Time Data Prior Expected Impact 17.05.16 2:00pm CPI y/y 0.5% 0.5% Actual > Forecast = Good for currency; GBPINR 17.05.16 2:00pm PPI Input m/m 2.0% 1.1% Actual > Forecast = Good for currency; GBPINR 17.05.16 2:00pm RPI y/y 1.6% 1.6% Actual > Forecast = Good for currency; GBPINR 17.05.16 6:00pm Building Permits 1.09M 1.13M Actual > Forecast = Good for currency; USDINR 17.05.16 6:00pm CPI m/m 0.1% 0.4% Actual > Forecast = Good for currency; USDINR 17.05.16 6:00pm Core CPI m/m 0.1% 0.2% Actual > Forecast = Good for currency; USDINR 17.05.16 6:00pm Housing Starts 1.09M 1.12M Actual > Forecast = Good for currency; USDINR 17.05.16 6:45pm Capacity Utilization Rate 74.8% 75.1% Actual > Forecast = Good for currency; USDINR 17.05.16 6:45pm Industrial Production m/m -0.6% 0.3% Actual > Forecast = Good for currency; USDINR 17th May’2016
- 5. Currency Highlights 17th May’2016 SEBI Certified – Research Analyst Equities I Commodities I Currencies I Mutual Funds Amit Pathania Digitally signed by Amit Pathania DN: cn=Amit Pathania, o=Choice Equity Broking Pvt. ltd, ou=Research Department, email=amit.pathania@choiceindia.com, c=IN Date: 2016.05.17 08:40:24 +05'30'