
Recommended
More Related Content
What's hot
What's hot (20)
Similar to Currency high lights 08.06.16
Similar to Currency high lights 08.06.16 (20)
Recently uploaded
Recently uploaded (20)
Currency high lights 08.06.16
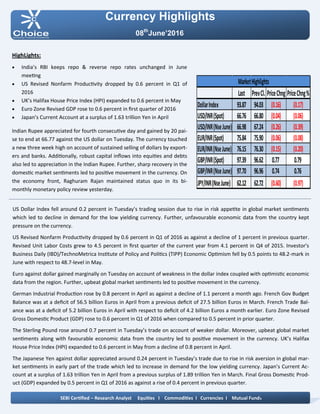
- 1. Currency Highlights 08th June’2016 HighLights: India’s RBI keeps repo & reverse repo rates unchanged in June meeting US Revised Nonfarm Productivity dropped by 0.6 percent in Q1 of 2016 UK’s Halifax House Price Index (HPI) expanded to 0.6 percent in May Euro Zone Revised GDP rose to 0.6 percent in first quarter of 2016 Japan’s Current Account at a surplus of 1.63 trillion Yen in April Indian Rupee appreciated for fourth consecutive day and gained by 20 pai- se to end at 66.77 against the US dollar on Tuesday. The currency touched a new three week high on account of sustained selling of dollars by export- ers and banks. Additionally, robust capital inflows into equities and debts also led to appreciation in the Indian Rupee. Further, sharp recovery in the domestic market sentiments led to positive movement in the currency. On the economy front, Raghuram Rajan maintained status quo in its bi- monthly monetary policy review yesterday. US Dollar Index fell around 0.2 percent in Tuesday’s trading session due to rise in risk appetite in global market sentiments which led to decline in demand for the low yielding currency. Further, unfavourable economic data from the country kept pressure on the currency. US Revised Nonfarm Productivity dropped by 0.6 percent in Q1 of 2016 as against a decline of 1 percent in previous quarter. Revised Unit Labor Costs grew to 4.5 percent in first quarter of the current year from 4.1 percent in Q4 of 2015. Investor's Business Daily (IBD)/TechnoMetrica Institute of Policy and Politics (TIPP) Economic Optimism fell by 0.5 points to 48.2-mark in June with respect to 48.7-level in May. Euro against dollar gained marginally on Tuesday on account of weakness in the dollar index coupled with optimistic economic data from the region. Further, upbeat global market sentiments led to positive movement in the currency. German Industrial Production rose by 0.8 percent in April as against a decline of 1.1 percent a month ago. French Gov Budget Balance was at a deficit of 56.5 billion Euros in April from a previous deficit of 27.5 billion Euros in March. French Trade Bal- ance was at a deficit of 5.2 billion Euros in April with respect to deficit of 4.2 billion Euros a month earlier. Euro Zone Revised Gross Domestic Product (GDP) rose to 0.6 percent in Q1 of 2016 when compared to 0.5 percent in prior quarter. The Sterling Pound rose around 0.7 percent in Tuesday’s trade on account of weaker dollar. Moreover, upbeat global market sentiments along with favourable economic data from the country led to positive movement in the currency. UK’s Halifax House Price Index (HPI) expanded to 0.6 percent in May from a decline of 0.8 percent in April. The Japanese Yen against dollar appreciated around 0.24 percent in Tuesday’s trade due to rise in risk aversion in global mar- ket sentiments in early part of the trade which led to increase in demand for the low yielding currency. Japan’s Current Ac- count at a surplus of 1.63 trillion Yen in April from a previous surplus of 1.89 trillion Yen in March. Final Gross Domestic Prod- uct (GDP) expanded by 0.5 percent in Q1 of 2016 as against a rise of 0.4 percent in previous quarter. SEBI Certified – Research Analyst Equities I Commodities I Currencies I Mutual Funds Last PrevCl. PriceChng PriceChng% DollarIndex 93.87 94.03 (0.16) (0.17) USD/INR(Spot) 66.76 66.80 (0.04) (0.06) USD/INR(NseJune) 66.98 67.24 (0.26) (0.39) EUR/INR(Spot) 75.84 75.90 (0.06) (0.08) EUR/INR(NseJune) 76.15 76.30 (0.15) (0.20) GBP/INR(Spot) 97.39 96.62 0.77 0.79 GBP/INR(NseJune) 97.70 96.96 0.74 0.76 JPY/INR(NseJune) 62.12 62.72 (0.60) (0.97) MarketHighlights
- 2. Technical View: The JPYINR price has been trading in rectangle pattern form past few weeks and prices are facing resistance of its upper band of channel pattern at 62.50 levels on hourly chart. In addition, on four hourly chart price has formed hanging man candle stick pattern , which is bearish reversal pattern. On hourly chart, momentum oscillator RSI has moved below 60 levels, which gives negative confirmation to the prices. A momentum indicator MACD has shown negative crossover on hourly chart, which indicates short term trend remains bearish. For now we expect prices to move lower towards 61.70 levels in few trading sessions. Pivot levels for the Day Technical View: The price has been moving in its rising channel formation from past few weeks and price has given breakdown of its of its lower band of channel pattern at 67.10 levels on daily chart. Moreover, price have been trading below of its 21 daily expo- nential moving average which suggest near term trend re- mains down. So any rally in the prices towards 67.20 level, used as selling opportunity. A momentum indicator RSI has moved below 60 levels on daily chart, which suggest bearishness in the prices. A momentum indictor MACD has given negative crossover on daily chart, which gives negative confirmation to the prices. For now we expect prices to move lower towards 66.60 lev- els in few trading sessions. Currency Highlights 08th June’2016 USDINR JPYINR SEBI Certified – Research Analyst Equities I Commodities I Currencies I Mutual Funds S3 S2 S1 Pivot R1 R2 R3 USDINR 66.51 66.77 66.87 67.03 67.13 67.29 67.55 JPYINR 61.46 61.83 61.98 62.20 62.35 62.57 62.94
- 3. Pivot levels for the Day Currency Highlights 08th June’2016 GBPINR EURINR Technical View: The pair has given breakdown of its symmetrical triangle pattern at 76.10 levels on daily chart. Now, the price has re- tested the breakdown trend line at 76.30 levels. On the other hand, Pair has been trading below its 21 half hourly exponential moving average which indicates that trend is remains negative. A momentum oscillator RSI have been trading below 60 lev- els on hourly chart which gives the signs of bearishness to the prices. Moreover, momentum indicator MACD has shown negative crossover on hourly chart which support our bearish view on the pair. For now we expect prices should move lower towards 75.70 levels in the coming trading sessions. Technical View: The prices have been moving in rising channel formation form past few weeks and price has taken support of its low- er band of its channel pattern at 97 levels on daily chart. The pair has formed Moring star candle stick pattern on daily chart, which is bullish pattern. On the other hand, Pair has been trading above its 50 hourly exponential moving average which indicates that medium term trend is remains bullish. A momentum indicator RSI has moved above 45 levels on daily chart, which suggest bullishness in the prices. Moreover, momentum indicator MACD has shown positive crossover on 4 hourly chart which support our bullish view on the pair. For now we expect prices should move higher towards 98.30 levels in the coming trading sessions. SEBI Certified – Research Analyst Equities I Commodities I Currencies I Mutual Funds S3 S2 S1 Pivot R1 R2 R3 GBPINR 95.38 96.53 97.11 97.68 98.26 98.83 99.98 EURINR 75.76 75.97 76.05 76.18 76.26 76.39 76.60
- 4. Currency Highlights SEBI Certified – Research Analyst Equities I Commodities I Currencies I Mutual Funds Economic Indicators Date Time Data Prior Expected Impact 08.06.16 5:20am Current Account 1.89T 2.04T Actual > Forecast = Good for currency; JPYINR 08.06.16 5:20am Final GDP q/q 0.4% 0.5% Actual > Forecast = Good for currency; JPYINR 08.06.16 Tentative Trade Balance 298B 358B Actual > Forecast = Good for currency; Yuan 08.06.16 2:00pm Manufacturing Production m/m 0.1% 0.1% Actual > Forecast = Good for currency; GBPINR 08.06.16 7:30pm JOLTS Job Openings 5.76M 5.82M Actual > Forecast = Good for currency; USDINR 08.06.16 8:00pm Crude Oil Inventories Actual < Forecast = Good for Crude Oil 08th June’2016
- 5. Currency Highlights 08th June’2016 SEBI Certified – Research Analyst Equities I Commodities I Currencies I Mutual Funds Amit Pathania Digitally signed by Amit Pathania DN: cn=Amit Pathania, o=Choice Equity Broking Pvt. ltd, ou=Research Department, email=amit.pathania@choiceindia.com, c=IN Date: 2016.06.08 08:47:46 +05'30'