1. Currency Highlights
22nd
Feb’2017
HighLights:
Indian Rupee rose for third day in row to 66.93 on Monday
US Flash Manufacturing PMI plunged to 54.3-mark in Feb’17
Euro Zone Flash Manufacturing PMI rose to 55.5-mark in Feb
UK Public Sector Net Borrowing at deficit 9.8 bn Pounds Jan
Indian Rupee gained for third consecutive day and appreciated around
9 paise to end at 66.93 against the US dollar on Monday. The currency
appreciated on account of selling of dollars from exporters and banks
coupled with upbeat domestic market sentiments. Since the beginning
of the current year, the rupee has gained around 1.45 percent. On the
other hand, foreign institutional investors have bought $373.20 mil-
lion and $567 million from local equity and debt markets respectively.
Indian Rupee moved in the range of 66.90 to 67.10 in Monday’s trad-
ing session. The Reserve Bank of India (RBI) fixed reference rate for
the dollar was seen at 66.9771 and Euro stood at 71.0560 as on 20th
Feb’17.
For the month of February 2017, FII outflows in equities totalled at Rs.11061.52 crores ($1648.20 million) as on 21st February
2017. Year to date basis, net capital outflows stood at Rs.9884.92 crores ($1475.36 million) as on 21st February 2017.
US Dollar Index rose around 0.4 percent in Tuesday’s trading session due to rise in risk aversion in global market sentiments in
early part of the trade which led to increase in demand for the low yielding currency. However, sharp upside in the currency
was capped as a result of unfavourable economic data from the country. US Flash Manufacturing Purchasing Managers' Index
(PMI) plunged by 0.7 points to 54.3-mark in February as against a rise of 55-level in January. Flash Services PMI declined by 1.7
points to 53.9-level in current month from 55.6-mark in January.
Euro against dollar dropped around 0.7 percent on Tuesday on account of strength in the dollar index. However, upbeat global
market sentiments in later part of the trade coupled with mixed economic data from the region cushioned sharp downside in
the currency. French Flash Manufacturing Purchasing Managers' Index (PMI) declined by 1.3 points to 52.3-mark in February
as against a rise of 53.6-level in January. French Flash Services PMI gained by 2.6 points to 56.7-level in current month from
54.1-mark in January. German Flash Manufacturing PMI rose marginally by 0.6 points to 57-mark in February when compared
to 56.4-level in earlier month. German Flash Services PMI jumped by 1 points to 54.4-level in existing month with respect to
53.4-mark in January. Euro Zone Flash Manufacturing PMI increased to 55.5-mark in February as compared to 55.2-level a
month ago. Euro Zone Flash Services PMI rose by 1.9 points to 55.6-level in present month from 53.7-mark in January.
The Sterling Pound grew around 0.1 percent in Tuesday’s trade on account of favourable economic data from the country
along with upbeat global market sentiments in later part of the trade. However, sharp upside in the currency was restricted
due to stronger dollar. UK’s Public Sector Net Borrowing was at a deficit of 9.8 billion Pounds in January from a surplus of 4.2
billion Pounds in December.
The Japanese Yen against dollar depreciated around 0.5 percent in Tuesday’s trading session due to rise in risk appetite in
global market sentiments in later part of the trade which led to decline in demand for the low yielding currency.
SEBI Certified – Research Analyst Equities I Commodities I Currencies I Mutual Funds
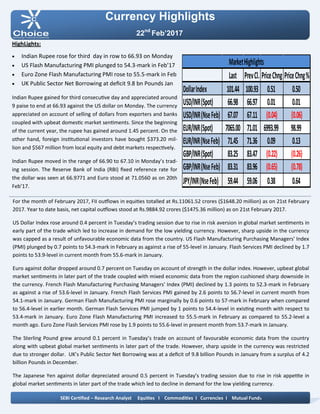
Last PrevCl. PriceChng PriceChng%
DollarIndex 101.44 100.93 0.51 0.50
USD/INR(Spot) 66.98 66.97 0.01 0.01
USD/INR(NseFeb) 67.07 67.11 (0.04) (0.06)
EUR/INR(Spot) 7065.00 71.01 6993.99 98.99
EUR/INR(NseFeb) 71.45 71.36 0.09 0.13
GBP/INR(Spot) 83.25 83.47 (0.22) (0.26)
GBP/INR(NseFeb) 83.31 83.96 (0.65) (0.78)
JPY/INR(NseFeb) 59.44 59.06 0.38 0.64
MarketHighlights
2. Technical View:
On a daily chart, the pair has taken the support of its ris-
ing channel pattern at 58.20 levels.
The pair has been trading in horizontal channel pattern
from past few weeks and price has taken the support of
its lower band at 58.50 levels on the daily chart.
Moreover, prices have been trading above its 21HSMA
which gives the sign of bullishness in the prices.
On daily chart momentum indicator, RSI is trading above
45 levels which indicate upside momentum can be seen
in the prices.
In addition, momentum indicator MACD has shown posi-
tive crossover which suggests strength in the prices on
the daily chart.
So for trading perspective, one can JPYINR buy in the
range of 59.15 with SL of 58.90 for the target of 59.65
levels.
Pivot levels for the Day
Technical View:
The pair has been trading in falling channel pattern from
past few weeks and price has taken the support of its
lower band of channel pattern at 66.70 levels on the
hourly chart.
Moreover, prices have been trading above its 21 HSMA
which gives the sign of bullishness in the prices.
A momentum indicator RSI has taken support at 30 lev-
els, which suggest further positive momentum can be
seen in the prices.
In addition, momentum indicator MACD has shown pos-
itive crossover and moving above its signal line on an
hourly chart.
So for trading perspective, one can buy USDINR in range
66.90 with SL of 66.70 for the target of 67.30.
Currency Highlights
22nd
Feb’2017
USDINR JPYINR
SEBI Certified – Research Analyst Equities I Commodities I Currencies I Mutual Funds
S3 S2 S1 Pivot R1 R2 R3
USDINR 66.63 66.82 66.89 67.01 67.08 67.20 67.39
JPYINR 58.68 58.99 59.12 59.30 59.43 59.61 59.92
3. Pivot levels for the Day
Currency Highlights
22nd
Feb’2017
GBPINR EURINR
Technical View:
The prices have been trading in falling channel pattern
from past few months and price has faced the re-
sistance of its upper band of channel pattern at 73 lev-
els on a daily chart.
The pair has been trading below its 21 DSMA on the
hourly chart, which suggests further weakness can be
seen in the prices.
On daily chart momentum oscillator, RSI has been mov-
ing below 50 levels on the hourly chart, which suggests
bearishness in the prices.
A momentum indicator MACD has shown negative
crossover on the hourly chart, which supports our bear-
ish view on the prices.
For now, we can expect prices should move lower to-
wards 70.40 levels in the coming trading session.
Technical View:
The pair has been trading in symmetrical triangle for-
mation from past few weeks and price has faced the
resistance of its upper band of the pattern at 85.80 lev-
els on the daily chart.
Moreover, prices have been trading below 21 DSMA,
which suggest short term trend looks down.
Moreover, momentum indicator MACD has given nega-
tive crossover on a daily chart, which gives the sign of
bearishness in the prices.
The momentum indicator RSI has been trading below
60 levels on the daily chart, which suggest the possibili-
ties of further downside momentum in the prices.
For now, we expect prices should move lower to-
wards 82.60 levels coming trading sessions.
SEBI Certified – Research Analyst Equities I Commodities I Currencies I Mutual Funds
S3 S2 S1 Pivot R1 R2 R3
GBPINR 82.55 83.00 83.26 83.45 83.71 83.90 84.35
EURINR 70.71 70.96 71.07 71.21 71.32 71.46 71.71
4. Currency Highlights
SEBI Certified – Research Analyst Equities I Commodities I Currencies I Mutual Funds
22nd
Feb’2017
Economic Indicators
Date Time Data Prior Expected Impact
22.02.17 03:00 PM Second Estimate GDP q/q 0.6% 0.6% Actual > Forecast = Good for
currency; GBPINR
22.02.17 03:30 PM Final CPI y/y 1.8% 1.8% Actual > Forecast = Good for
currency; EURINR
22.02.17 03:30 PM Final Core CPI y/y 0.9% 0.9% Actual > Forecast = Good for
currency; EURINR
22.02.17 08:30 PM Existing Home Sales 5.49M 5.55M Actual > Forecast = Good for
currency; USDINR
5. Currency Highlights
22nd
Feb’2017
SEBI Certified – Research Analyst Equities I Commodities I Currencies I Mutual Funds
Anish Vyas
Digitally signed by Anish Vyas
DN: cn=Anish Vyas, o=Choice Merchandise
Broking Pvt. Ltd, ou=Sr. Research Associate,
email=anish.vyas@choiceindia.com, c=IN
Date: 2017.02.22 08:35:49 +05'30'