
Recommended
More Related Content
What's hot
What's hot (20)
Viewers also liked
Similar to Currency high lights 06.05.16
Similar to Currency high lights 06.05.16 (20)
Recently uploaded
Recently uploaded (20)
Currency high lights 06.05.16
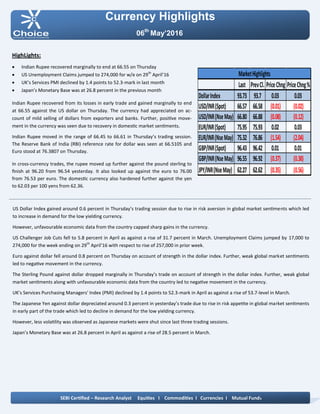
- 1. Currency Highlights 06th May’2016 HighLights: Indian Rupee recovered marginally to end at 66.55 on Thursday US Unemployment Claims jumped to 274,000 for w/e on 29th April’16 UK’s Services PMI declined by 1.4 points to 52.3-mark in last month Japan’s Monetary Base was at 26.8 percent in the previous month Indian Rupee recovered from its losses in early trade and gained marginally to end at 66.55 against the US dollar on Thursday. The currency had appreciated on ac- count of mild selling of dollars from exporters and banks. Further, positive move- ment in the currency was seen due to recovery in domestic market sentiments. Indian Rupee moved in the range of 66.45 to 66.61 in Thursday’s trading session. The Reserve Bank of India (RBI) reference rate for dollar was seen at 66.5105 and Euro stood at 76.3807 on Thursday. In cross-currency trades, the rupee moved up further against the pound sterling to finish at 96.20 from 96.54 yesterday. It also looked up against the euro to 76.00 from 76.53 per euro. The domestic currency also hardened further against the yen to 62.03 per 100 yens from 62.36. US Dollar Index gained around 0.6 percent in Thursday’s trading session due to rise in risk aversion in global market sentiments which led to increase in demand for the low yielding currency. However, unfavourable economic data from the country capped sharp gains in the currency. US Challenger Job Cuts fell to 5.8 percent in April as against a rise of 31.7 percent in March. Unemployment Claims jumped by 17,000 to 274,000 for the week ending on 29th April’16 with respect to rise of 257,000 in prior week. Euro against dollar fell around 0.8 percent on Thursday on account of strength in the dollar index. Further, weak global market sentiments led to negative movement in the currency. The Sterling Pound against dollar dropped marginally in Thursday’s trade on account of strength in the dollar index. Further, weak global market sentiments along with unfavourable economic data from the country led to negative movement in the currency. UK’s Services Purchasing Managers' Index (PMI) declined by 1.4 points to 52.3-mark in April as against a rise of 53.7-level in March. The Japanese Yen against dollar depreciated around 0.3 percent in yesterday’s trade due to rise in risk appetite in global market sentiments in early part of the trade which led to decline in demand for the low yielding currency. However, less volatility was observed as Japanese markets were shut since last three trading sessions. Japan’s Monetary Base was at 26.8 percent in April as against a rise of 28.5 percent in March. SEBI Certified – Research Analyst Equities I Commodities I Currencies I Mutual Funds Last PrevCl. PriceChng PriceChng% DollarIndex 93.73 93.7 0.03 0.03 USD/INR(Spot) 66.57 66.58 (0.01) (0.02) USD/INR(NseMay) 66.80 66.88 (0.08) (0.12) EUR/INR(Spot) 75.95 75.93 0.02 0.03 EUR/INR(NseMay) 75.32 76.86 (1.54) (2.04) GBP/INR(Spot) 96.43 96.42 0.01 0.01 GBP/INR(NseMay) 96.55 96.92 (0.37) (0.38) JPY/INR(NseMay) 62.27 62.62 (0.35) (0.56) MarketHighlights
- 2. Technical View: The JPYINR price has been trading in rising wedge formation form past few weeks. Price has faced strong resistance of up- per band of wedge pattern at 63 levels on daily chart. Moreover, Pair has been trading below its 50 hourly exponen- tial moving average which suggest short term trend remains down. On daily chart, momentum oscillator RSI has faced resistance of horizontal trend line at 62 levels which suggest more selling opportunity can be seen on higher side. A momentum indicator MACD has shown negative sign on daily chart, which indicates short term trend remains nega- tive. Pivot levels for the Day Technical View: The USDINR price has given breakdown of its rising channel formation at 66.90 levels on hourly chart. Moreover, price has been moving in rectangle pattern and facing resistance at 67 levels on daily chart. On hourly chart, USDINR has formed bearish engulfing pattern which is bearish reversal pattern. Moreover, price have been trading below its 60 Hourly exponential moving average so any rally towards 66.90 level, it would become the best selling opportunity in near term. A momentum indicator RSI has been trading below 60 levels on hourly chart, which suggest bearishness in the prices. Momentum indictor MACD has shown negative signs and trading below single line on daily chart, which gives negative confirmation to the prices. For now we expect prices to move lower towards 67.50levels in few trading sessions. Currency Highlights 06th May’2016 USDINR JPYINR SEBI Certified – Research Analyst Equities I Commodities I Currencies I Mutual Funds S3 S2 S1 Pivot R1 R2 R3 USDINR 66.46 66.63 66.72 66.80 66.89 66.97 67.14 JPYINR 61.65 61.96 62.11 62.27 62.42 62.58 62.89
- 3. Pivot levels for the Day Currency Highlights 06th May’2016 GBPINR EURINR Technical View: The price has been trading in rising channel formation and facing resistance of upper band of channel pattern at 77.50 levels. Price has given breakdown its symmetrical pattern at 76.60 levels on hourly chart. On the other hand, Pair has been trading below its 50 daily exponential moving average which indicates that trend is remains down. A momentum oscillator RSI have been trading below 60 lev- els on daily chart which gives bearishness to the prices. Moreover, momentum indicator MACD has shown negative crossover on four hourly chart which support our bearish view on the pair. For now we expect prices should move lower towards 75.90 levels in the coming trading sessions. Technical View: The price has been trading in falling channel pattern and fac- ing resistance of upper band of channel pattern at 98 levels on daily chart. Moreover, price has formed the evening star candle stick pattern with confirmation on daily chart. on the other hand, Pair has been trading below its 100 daily exponential moving average which indicates that trend is remains down. On hourly chart, GBPINR has given breakdown of its falling channel pattern at 96.80 levels . A momentum oscillator RSI have been trading below 60 levels on daily chart which gives bearishness to the prices. Moreover, momentum indicator MACD has shown negative sign on daily chart which support our bullish view on the pair. SEBI Certified – Research Analyst Equities I Commodities I Currencies I Mutual Funds S3 S2 S1 Pivot R1 R2 R3 GBPINR 95.57 96.14 96.34 96.71 96.91 97.28 97.85 EURINR 75.36 75.92 76.12 76.48 76.68 77.04 77.60
- 4. Currency Highlights SEBI Certified – Research Analyst Equities I Commodities I Currencies I Mutual Funds Economic Indicators Date Time Data Prior Expected Impact 06.05.16 4:10am Retail PMI 49.2 Actual > Forecast = Good for currency; EURINR 06.05.16 8:30am Average Hourly Earnings m/m 0.3% 0.3% Actual > Forecast = Good for currency; USDINR 06.05.16 8:30am Non-Farm Employment Change 215K 203K Actual > Forecast = Good for currency; USDINR 06.05.16 8:30am Unemployment Rate 5.0% 5.0% Actual > Forecast = Good for currency; USDINR 06.05.16 3:00pm Consumer Credit m/m 17.2B 16.1B Actual > Forecast = Good for currency; USDINR 06th May’2016
- 5. Currency Highlights 06th May’2016 SEBI Certified – Research Analyst Equities I Commodities I Currencies I Mutual Funds Vikas Chaudhari Digitally signed by Vikas Chaudhari DN: cn=Vikas Chaudhari, o=Choice Equity Broking Pvt Ltd, ou=Research Department, email=vikas.chaudhari@choiceindia.com, c=IN Date: 2016.05.06 08:45:16 +05'30'