Famous Kala Jadu, Black magic expert in Faisalabad and Kala ilam specialist i...
Currency high lights 05.10.16
1. Currency Highlights
05th
Oct’2016
HighLights:
India’s RBI cuts repo rates to 6.25 percent in yesterday’s meeting
Spanish Unemployment Change surged to 22,800 in October
UK’s Construction PMI surged to 52.3-mark in month of Septem-
ber
Japan’s Consumer Confidence grew to 43-mark in the last month
Indian Rupee gained for third consecutive day and appreciated by 13
paise to end at 66.46 against the US dollar on Tuesday. The currency
appreciated after central bank cut its key rates, upbeat domestic mar-
ket sentiments along with selling of dollars from exporters and banks.
Foreign institutional investors remained net sellers in the domestic
equity markets on Monday as they sold shares worth of Rs.183.83
crore yesterday, according to the data available with NSDL. Their gross
purchases stood at Rs.5293.71 crore and gross sales remained at
Rs.5477.54 crore. Foreign portfolio investors (FPIs) have bought equi-
ties worth $7.5 billion in the Indian markets in 2016.
Indian Rupee moved in the range of 66.3988 to 66.6062 in Tuesday’s trading session. The Reserve Bank of India (RBI) fixed ref-
erence rate for the dollar was seen at 66.5559 and Euro stood at 74.4428 as on 4th
October, 2016.
In cross-currency trades, the rupee maintained its strong edge against the pound sterling and finished at 84.68 from 85.70 and
hardened against the Japanese yen to close at 64.87 compared to 65.70 per 100 yens on Friday. It also recovered against the
euro to settle at 74.20 from 74.81 earlier.
India’s RBI cuts repo rates by 25 bps to 6.25 percent in October as against 6.5 percent in September. Reserve repo rates also
cut by 25 bps to 5.75 percent in current month from 6 percent in September. Cash Reserve Ratio (CRR) unchanged at 4 percent
in the month of October.
US Dollar Index rose around 0.5 percent in Tuesday’s trading session due to rise in risk aversion in global markets which led to
increase in demand for the low yielding currency. However, sharp upside in the currency was capped after International Mone-
tary Fund (IMF) cuts the US growth forecast to 1.6 percent from 2.2 percent in previous projections.
Euro against dollar declined around 0.1 percent on Tuesday on account of strength in the dollar index along with weak global
market sentiments. Moreover, unfavourable economic data from the region kept pressure on the currency. Spanish Unem-
ployment Change surged to 22,800 in September with respect to 14,400 in August.
The Sterling Pound plunged around 0.9 percent in Tuesday’s trade as a result of stronger dollar index coupled with weak global
market sentiments. However, sharp downside in the currency was prevented due to favourable economic data from the coun-
try. UK’s Construction Purchasing Managers' Index (PMI) surged by 3.1 points to 52.3-mark in September when compared to
gain of 49.2-level a month ago.
The Japanese Yen against dollar depreciated by more than 1 percent in Tuesday’s trading session due to rise in risk appetite in
global market sentiments in early part of the trade which led to decline in demand for the low yielding currency. Japan’s Con-
sumer Confidence grew by 1 points to 43-mark in September as against a rise of 42-level in August.
SEBI Certified – Research Analyst Equities I Commodities I Currencies I Mutual Funds
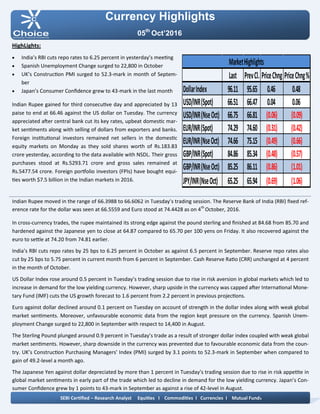
Last PrevCl. PriceChng PriceChng%
DollarIndex 96.11 95.65 0.46 0.48
USD/INR(Spot) 66.51 66.47 0.04 0.06
USD/INR(NseOct) 66.75 66.81 (0.06) (0.09)
EUR/INR(Spot) 74.29 74.60 (0.31) (0.42)
EUR/INR(NseOct) 74.66 75.15 (0.49) (0.66)
GBP/INR(Spot) 84.86 85.34 (0.48) (0.57)
GBP/INR(NseOct) 85.25 86.11 (0.86) (1.01)
JPY/INR(NseOct) 65.25 65.94 (0.69) (1.06)
MarketHighlights
2. Technical View:
On daily chart JPYINR prices have been trading in sym-
metrical triangle pattern and shown breakdown of its
symmetrical triangle pattern. However, price has formed
bearish candle stick on daily chart.
Moreover, breakdown can be seen in the prices with bol-
stering volumes.
Furthermore, prices have been trading below its 21 DE-
MA, which suggest short term trend is negative.
On daily chart momentum indicator RSI is trading below
at 45 levels which suggest further weakness in the pric-
es.
So for trading perspective, one could use sell in the
range of 65.40 with SL of 66.80 for Target of 67.70 levels.
Pivot levels for the Day
Technical View:
On daily USDINR prices have been trading in falling
channel formation from past few weeks. The pair has
formed bearish candle stick with appealing volumes.
On the other hand, prices have been facing resistance of
falling trend line at 66.85 levels on daily chart.
On the other hand, prices have been facing resistance of
its upper band of channel pattern at 67.10 levels on dai-
ly.
Moreover, prices have been trading below 21 DEMA
which gives the sign of bearishness in the prices.
A momentum indictor RSI has traded below 60 levels,
which suggest further weakness in the prices.
So for trading perspective, one could sell in range 66.85
with SL of 67.10 for target of 66.40
Currency Highlights
05th
Oct’2016
USDINR JPYINR
SEBI Certified – Research Analyst Equities I Commodities I Currencies I Mutual Funds
S3 S2 S1 Pivot R1 R2 R3
USDINR 66.30 66.52 66.63 66.74 66.85 66.96 67.18
JPYINR 64.60 64.95 65.11 65.30 65.46 65.65 66.00
3. Pivot levels for the Day
Currency Highlights
05th
Oct’2016
GBPINR EURINR
Technical View:
The EURINR pair has been trading in rising channel
pattern and price has shown breakdown of its rising
channel pattern at 75 levels on daily chart.
On daily chart EURINR price have been trading in de-
scending triangle pattern from past months.
Moreover, prices have been trading below its 21 DE-
MA, which suggest short term trend is down.
On daily chart momentum oscillator RSI have been trad-
ing below 60 which suggest bearishness in the prices.
A momentum indicator MACD has shown negative
crossover on daily chart, which add more bearishness in
the prices.
For now we can expect prices should move lower to-
wards 74.10 levels in the coming trading session.
Technical View:
On daily GBPINR price has been trading in falling chan-
nel pattern and price has shown breakdown of its falling
channel pattern at 86.50 levels on daily chart.
Moreover, prices have been trading below 21 DEMA,
which suggest short term trend remains weak.
The price has given breakdown of horizontal trend line
at 87.30 levels on daily chart.
A momentum indicator MADC has given negative Cross
over on daily chart, which gives the sign of bearishness
in the prices.
The momentum indictor RSI has been trading below 40
levels on daily chart. Which suggest lack of strength in
the prices.
For now we expect prices should move lower towards
84.60 levels coming trading sessions.
SEBI Certified – Research Analyst Equities I Commodities I Currencies I Mutual Funds
S3 S2 S1 Pivot R1 R2 R3
GBPINR 83.77 84.60 84.93 85.43 85.76 86.26 87.09
EURINR 73.90 74.29 74.48 74.68 74.87 75.07 75.46
4. Currency Highlights
SEBI Certified – Research Analyst Equities I Commodities I Currencies I Mutual Funds
05th
Oct’2016
Economic Indicators
Date Time Data Prior Expected Impact
05.10.16 2:00 pm Services PMI 52.9 52.10 Actual > Forecast = Good
for currency; GBPINR
05.10.16 5:45 pm ADP Non-Farm Employment
Change
177K 166K Actual > Forecast = Good
for currency; USDINR
05.10.16 7:30 PM ISM Non-Manufacturing PMI 51.4 53.10 Actual > Forecast = Good
for currency; USDINR
05.10.16 8:00 PM Crude Oil Inventories -1.9M
5. Currency Highlights
05th
Oct’2016
SEBI Certified – Research Analyst Equities I Commodities I Currencies I Mutual Funds
Amit Pathania
Digitally signed by Amit Pathania
DN: cn=Amit Pathania, o=Choice Equity Broking Pvt. ltd,
ou=Research Department,
email=amit.pathania@choiceindia.com, c=IN
Date: 2016.10.05 08:52:06 +05'30'