
Recommended
More Related Content
What's hot
What's hot (20)
Similar to Currency high lights 03.04.17
Similar to Currency high lights 03.04.17 (20)
Recently uploaded
Recently uploaded (20)
Currency high lights 03.04.17
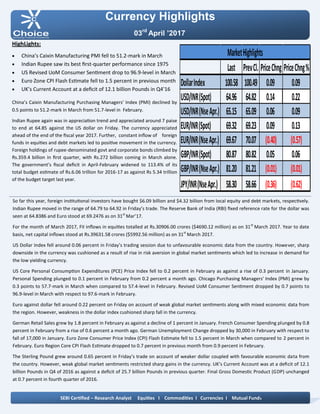
- 1. Currency Highlights 03rd April ’2017 HighLights: China’s Caixin Manufacturing PMI fell to 51.2-mark in March Indian Rupee saw its best first-quarter performance since 1975 US Revised UoM Consumer Sentiment drop to 96.9-level in March Euro Zone CPI Flash Estimate fell to 1.5 percent in previous month UK’s Current Account at a deficit of 12.1 billion Pounds in Q4’16 China’s Caixin Manufacturing Purchasing Managers' Index (PMI) declined by 0.5 points to 51.2-mark in March from 51.7-level in February. Indian Rupee again was in appreciation trend and appreciated around 7 paise to end at 64.85 against the US dollar on Friday. The currency appreciated ahead of the end of the fiscal year 2017. Further, constant inflow of foreign funds in equities and debt markets led to positive movement in the currency. Foreign holdings of rupee-denominated govt and corporate bonds climbed by Rs.359.4 billion in first quarter, with Rs.272 billion coming in March alone. The government’s fiscal deficit in April-February widened to 113.4% of its total budget estimate of Rs.6.06 trillion for 2016-17 as against Rs 5.34 trillion of the budget target last year. So far this year, foreign institutional investors have bought $6.09 billion and $4.32 billion from local equity and debt markets, respectively. Indian Rupee moved in the range of 64.79 to 64.92 in Friday’s trade. The Reserve Bank of India (RBI) fixed reference rate for the dollar was seen at 64.8386 and Euro stood at 69.2476 as on 31st Mar’17. For the month of March 2017, FII inflows in equities totalled at Rs.30906.00 crores ($4690.12 million) as on 31st March 2017. Year to date basis, net capital inflows stood at Rs.39631.58 crores ($5992.56 million) as on 31st March 2017. US Dollar Index fell around 0.06 percent in Friday’s trading session due to unfavourable economic data from the country. However, sharp downside in the currency was cushioned as a result of rise in risk aversion in global market sentiments which led to increase in demand for the low yielding currency. US Core Personal Consumption Expenditures (PCE) Price Index fell to 0.2 percent in February as against a rise of 0.3 percent in January. Personal Spending plunged to 0.1 percent in February from 0.2 percent a month ago. Chicago Purchasing Managers' Index (PMI) grew by 0.3 points to 57.7-mark in March when compared to 57.4-level in February. Revised UoM Consumer Sentiment dropped by 0.7 points to 96.9-level in March with respect to 97.6-mark in February. Euro against dollar fell around 0.22 percent on Friday on account of weak global market sentiments along with mixed economic data from the region. However, weakness in the dollar index cushioned sharp fall in the currency. German Retail Sales grew by 1.8 percent in February as against a decline of 1 percent in January. French Consumer Spending plunged by 0.8 percent in February from a rise of 0.6 percent a month ago. German Unemployment Change dropped by 30,000 in February with respect to fall of 17,000 in January. Euro Zone Consumer Price Index (CPI) Flash Estimate fell to 1.5 percent in March when compared to 2 percent in February. Euro Region Core CPI Flash Estimate dropped to 0.7 percent in previous month from 0.9 percent in February. The Sterling Pound grew around 0.65 percent in Friday’s trade on account of weaker dollar coupled with favourable economic data from the country. However, weak global market sentiments restricted sharp gains in the currency. UK’s Current Account was at a deficit of 12.1 billion Pounds in Q4 of 2016 as against a deficit of 25.7 billion Pounds in previous quarter. Final Gross Domestic Product (GDP) unchanged at 0.7 percent in fourth quarter of 2016. SEBI Certified – Research Analyst Equities I Commodities I Currencies I Mutual Funds Last PrevCl. PriceChng PriceChng% DollarIndex 100.58 100.49 0.09 0.09 USD/INR(Spot) 64.96 64.82 0.14 0.22 USD/INR(NseApr.) 65.15 65.09 0.06 0.09 EUR/INR(Spot) 69.32 69.23 0.09 0.13 EUR/INR(NseApr.) 69.67 70.07 (0.40) (0.57) GBP/INR(Spot) 80.87 80.82 0.05 0.06 GBP/INR(NseApr.) 81.20 81.21 (0.01) (0.01) JPY/INR(NseApr.) 58.30 58.66 (0.36) (0.62) MarketHighlights
- 2. Technical View: On a daily chart, the pair has been trading in horizontal channel pattern from past few months and price has taken the support of its horizontal channel pattern at 57.25 levels. Moreover, prices have been trading above its 10 HSMA which gives the sign of bullishness in the prices. On a daily chart momentum indicator, RSI is taking support at 30 levels which indicate pullback in the prices. In addition, momentum indicator MACD has shown positive crossover which suggests strength in the prices on a daily chart. So for trading perspective, one can buy JPYINR in the range of 58.25 with SL of 58 for the target of 59.75 levels. Pivot levels for the Day Technical View: The pair has given a breakdown of its “Symmetrical Triangle” pattern at 66.60 levels on a daily chart. Moreover, prices have been trading below its 50 DSMA which gives the sign of bearishness in the prices. Furthermore, the price has shown a breakdown of its consolidation range from 67.40 to 66.60 levels on a daily chart. A momentum indicator RSI has remained below 45 levels, which suggest further negative momentum can be seen in the prices. In addition, momentum indicator MACD has shown negative crossover and moving below its signal line on a daily chart. So for trading perspective, one can sell USDINR in the range of 65.20 with SL of 65.40 for the target of 64.80 levels. Currency Highlights 03rd April ’2017 USDINR JPYINR SEBI Certified – Research Analyst Equities I Commodities I Currencies I Mutual Funds S3 S2 S1 Pivot R1 R2 R3 USDINR 64.66 64.87 65.01 65.08 65.22 65.29 65.50 JPYINR 57.60 57.91 58.12 58.22 58.43 58.53 58.84
- 3. Pivot levels for the Day Currency Highlights 03rd April ’2017 GBPINR EURINR Technical View: On a daily chart, prices have been trading in falling channel pattern from past few weeks and price has taken the support of its lower band of channel pattern at 69.60 levels. The price has taken the support of its falling trend line at 69.50 levels o daily chart. The pair has been trading above its 10 HSMA on the hourly chart, which suggests further positive momentum can be seen in the prices. On a daily chart momentum oscillator, RSI has been taking support at 35 levels on a daily chart, which suggests bullishness in the prices. A momentum indicator MACD has shown positive crossover on the hourly chart, which supports our bullish view on the prices. For now, we can expect prices should move higher towards 70.30 levels in the coming trading session. Technical View: The pair has been trading in “Falling Wedge” pattern from past few weeks and price has taken the support of its lower band of the pattern at 80 levels on a daily chart. Moreover, prices have been trading above 10 HSMA, which suggest short term trend looks up. Moreover, momentum indicator MACD has given positive crossover on the hourly chart, which gives the sign of bullishness in the prices. A momentum indicator RSI has been trading near its support levels on the daily chart, which suggests the possibilities of further upside momentum in the prices. For now, we expect prices should move higher towards 81.80 levels in the coming trading sessions. SEBI Certified – Research Analyst Equities I Commodities I Currencies I Mutual Funds S3 S2 S1 Pivot R1 R2 R3 GBPINR 80.39 80.79 80.99 81.19 81.39 81.59 81.99 EURINR 69.02 69.33 69.50 69.64 69.81 69.95 70.26
- 4. Currency Highlights SEBI Certified – Research Analyst Equities I Commodities I Currencies I Mutual Funds 03rd April ’2017 Economic Indicators Date Time Data Prior Expected Impact 03.04.17 02:00 PM Manufacturing PMI 54.6 55.1 Actual > Forecast = Good for currency; GBPINR 03.04.17 07:30 PM ISM Manufacturing PMI 57.7 57.2 Actual > Forecast = Good for currency; USDINR 03.04.17 07:30 PM Construction Spending m/m -1.0% 1.0% Actual > Forecast = Good for currency; USDINR
- 5. Currency Highlights 03rd April ’2017 SEBI Certified – Research Analyst Equities I Commodities I Currencies I Mutual Funds Amit Pathania Digitally signed by Amit Pathania DN: cn=Amit Pathania, o=Choice Equity Broking Pvt. ltd, ou=Research Department, email=amit.pathania@choiceindia.com, c=IN Date: 2017.04.03 08:10:42 +05'30'